No votes yet.
Consumer Confidence Index Statistics: Key Data, Trends & Insights
Consumer confidence index statistics for 2026 from the Conference Board, University of Michigan, and Federal Reserve. The CCI reached a 12-year low of 84.5 in January 2026. Learn how low confidence periods drive better deal conditions for savvy shoppers.
When the Conference Board reported that US consumer confidence dropped to 84.5 in January 2026, the lowest reading in 12 years, financial news sites scrambled to ask the same question: are Americans about to stop spending? The answer, as a Federal Reserve study published just months earlier discovered, is more complicated than a single index reading suggests. Consumers feel worse about the economy than the data warrants. And yet the credit cards keep getting swiped.
This article compiles the latest consumer confidence index statistics from the Conference Board, the University of Michigan, the Federal Reserve, OECD, and academic researchers. The focus: what current readings actually mean for shoppers making real decisions.
Key Takeaways
- ✓ The Conference Board Consumer Confidence Index dropped to 84.5 in January 2026, its lowest reading since 2013, before recovering partially to 91.2 in February.
- ✓ The Expectations Index has been below the critical 80 recession threshold for 13+ consecutive months as of February 2026, the longest such streak since the 2008 financial crisis.
- ✓ University of Michigan Consumer Sentiment fell to 53.3 in March 2026, down from 56.6 in February, approaching the all-time low of 50.0 set in June 2022.
- ✓ Baby Boomers show a job market differential of +14.9% vs. only +2.1% for Gen Z, creating the widest generational confidence gap in recent history.
- ✓ A Federal Reserve study found consumers report pessimism while verified retail spending stayed strong, meaning low CCI periods correlate with higher coupon and deal-seeking behavior as shoppers reconcile the gap.
What Is the Consumer Confidence Index? An Overview
The Consumer Confidence Index, or CCI, measures how optimistic or pessimistic US households feel about current and future economic conditions. One number. Massive implications for everyone from Walmart buyers planning inventory to Federal Reserve economists deciding whether to cut rates.
Overview Statistics
- The Conference Board Consumer Confidence Index has been tracked since 1967, benchmarked to a base year of 1985=100.
- The index is built from monthly surveys of 5,000 US households, conducted by Toluna on behalf of the Conference Board.
- Two dominant US confidence measures exist: the Conference Board CCI and the University of Michigan Consumer Sentiment Index, which dates back to 1952.
- Consumer spending accounts for approximately 65% of US GDP, making confidence surveys among the most closely watched leading indicators in economics.
- For the OECD’s composite measure, readings above 100 indicate optimism while readings below 100 signal pessimism relative to a historical average.
- The Conference Board CCI all-time high was 144.7, recorded in the year 2000 during the dot-com boom.
The CCI started in 1967, benchmarked to 1985=100. When the index sits above 100, households generally feel good about jobs and personal finances. Below 100, the mood shifts. The headline number covers two very different components: how people feel right now (Present Situation Index) and what they expect six months from now (Expectations Index). Those two can tell completely opposite stories at the same time.
Why does it matter who’s watching? Manufacturers adjust production runs based on CCI data. Retailers plan promotional calendars around it. Banks price consumer credit differently when confidence softens. And retailers running coupon and discount campaigns know that low-confidence periods tend to drive more aggressive deal-seeking from shoppers.
The two primary US indexes aren’t identical. The University of Michigan Surveys of Consumers uses a different methodology, a different scale (indexed to 1966:Q1=100), and surveys a smaller sample of 500+ adults monthly. Both indexes often diverge. The UNC Kenan Institute noted in 2024 that the two surveys tell a “more nuanced story” than a single headline suggests. Part of that divergence comes down to methodology differences between them.
How the Consumer Confidence Index Is Calculated
The Conference Board’s CCI is built from five survey questions asked monthly to 5,000 US households. The methodology is more structured than most people realize.
Methodology Statistics
- The Conference Board surveys 5,000 US households monthly through Toluna, with responses collected over a two-week window.
- Five questions cover: current business conditions, expected business conditions in 6 months, current employment conditions, expected employment conditions in 6 months, and expected family income in 6 months.
- The Present Situation Index is derived from questions 1 and 3 (current conditions), accounting for roughly 40% of the headline number.
- The Expectations Index comes from questions 2, 4, and 5 (forward-looking), making up approximately 60% of the composite.
- Results are released on the last Tuesday of every month at 10am Eastern Time.
- The University of Michigan’s Surveys of Consumers uses 500+ monthly phone interviews and 50 core questions, indexed to 1966:Q1=100.
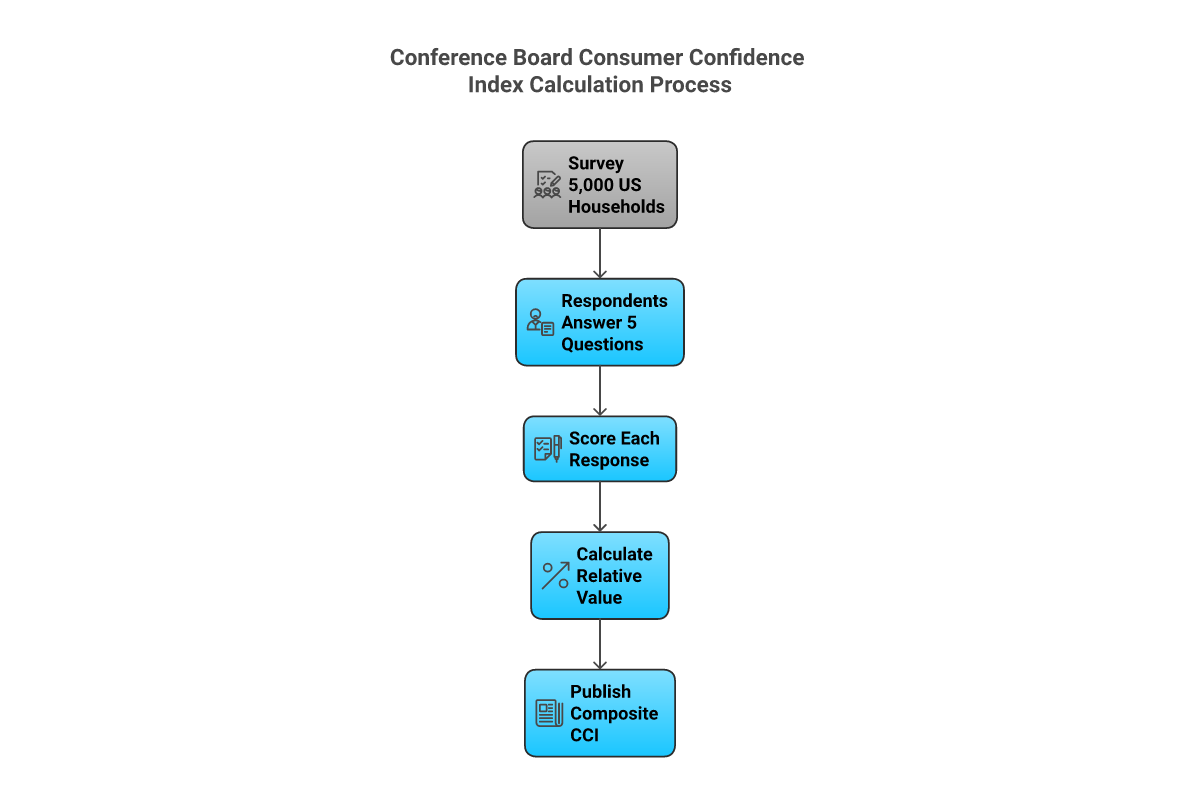
The scoring formula is relative: each question’s result is calculated as positive responses divided by positive plus negative responses. That ratio gets compared to the same ratio from the 1985 baseline year. So when the report says “91.2,” the number means households feel 91.2% as confident as they did on average during 1985. Not a great comparison, given 1985 was a pretty ordinary year for the US economy.
The University of Michigan’s Surveys of Consumers takes a different approach. Researchers conduct 500+ monthly phone interviews using 50 core questions. The final Index of Consumer Sentiment (ICS) combines a Current Economic Conditions index with a Consumer Expectations index, using 1966:Q1=100 as the baseline. The two measures often correlate but not always. When they diverge significantly, it’s usually worth asking why.
Current Consumer Confidence Index Statistics
The Conference Board CCI stood at 91.2 in February 2026, up 2.2 points from January’s 12-year low of 84.5. That partial recovery masked ongoing weakness underneath.
Current Readings (Early 2026)
- The Conference Board CCI reached 91.2 in February 2026, recovering from January’s low of 84.5, which was the weakest reading since 2013.
- The Present Situation Index registered 120.0 in February 2026, down 1.8 points from January, indicating consumers still feel reasonably good about current conditions.
- The Expectations Index came in at 72.0 in February 2026, up 4.8 points but still below the critical 80 threshold that has historically preceded recessions.
- The Expectations Index has been below 80 for 13 or more consecutive months as of February 2026, the longest sustained run below that level since the 2008 financial crisis.
- University of Michigan Consumer Sentiment fell to 53.3 in March 2026, down from 56.6 in February 2026, per the Surveys of Consumers.
- The CCI peaked at 112.8 in November 2024, then declined through early 2026 as inflation concerns and trade policy uncertainty weighed on sentiment.
- Consumer confidence declined to 88.7 in November 2025, down 6.8 points from October’s elevated reading of 121.2.
91.2
CCI Feb 2026
120.0
Present Situation
72.0
Expectations Index
53.3
Michigan Sentiment Mar 2026
Here’s what the split tells you. The Present Situation Index at 120.0 says consumers think things are fine right now. Jobs exist, income is flowing. But the Expectations Index at 72.0 says those same consumers expect things to get worse over the next six months. That gap between “today is okay” and “tomorrow looks rough” has been widening since mid-2024.
The University of Michigan published a preliminary March 2026 reading of 55.5 for the Index of Consumer Sentiment, with Current Economic Conditions at 57.8 and Consumer Expectations at 54.1. The final March number came in at 53.3. Both figures sit well below what most economists consider healthy territory.
Inflation and trade policy uncertainty dominated the reasons cited by survey respondents. These aren’t abstract concerns: consumers who’ve watched grocery prices stay stubbornly elevated for two-plus years don’t need an economic model to feel uncertain.
Historical Consumer Confidence Index Data and Trends
The CCI’s historical record runs over 70 years for the Michigan index and nearly 60 years for the Conference Board. That long track record reveals patterns that single-year comparisons miss.
Historical Statistics
- The Conference Board CCI all-time high was 144.7, recorded in the year 2000 during the peak of the dot-com expansion.
- The University of Michigan Consumer Sentiment all-time high was 111.4, recorded in January 2000.
- The University of Michigan all-time low was 50.0, recorded in June 2022 during peak post-pandemic inflation.
- The Conference Board CCI dropped from 132.6 in February 2020 to 85.7 in April 2020 as COVID-19 shutdowns hit, a decline of nearly 47 points in two months.
- The CCI recovered to 127.3 by June 2021 as vaccines rolled out and stimulus spending boosted household finances.
- The University of Michigan Consumer Sentiment averaged 84.6 from 1952 through early 2026, meaning current readings in the mid-50s are well below historical norms.
- The average CCI at the start of US recessions historically has been 101.9, a level the US has been below since February 2025.
The table below shows recent monthly CCI and Michigan Sentiment readings from the Federal Reserve Economic Data (FRED) series for the University of Michigan Surveys of Consumers:
| Month | Michigan Consumer Sentiment (UMCSENT) |
|---|---|
| January 2025 | 79.0 |
| February 2025 | 76.9 |
| March 2025 | 79.4 |
| April 2025 | 77.2 |
| May 2025 | 69.1 |
| June 2025 | 68.2 |
| July 2025 | 66.4 |
| August 2025 | 67.9 |
| September 2025 | 70.1 |
| October 2025 | 70.5 |
| November 2025 | 71.8 |
| December 2025 | 74.0 |
| February 2026 | 56.6 |
| March 2026 | 53.3 |
Source: University of Michigan via Federal Reserve Economic Data (FRED), series UMCSENT.
The 2022 collapse stands out as the modern reference point for how bad consumer sentiment can get. June 2022’s reading of 50.0 came as US inflation hit 9.1%, the highest in 40 years. The current trajectory, while not yet at that extreme, is moving in a similar direction driven by similar forces: persistent price increases and uncertainty about whether conditions will improve.
The Conference Board CCI’s own historical pattern shows volatility around major events: the dot-com bust brought the index from near 145 to below 80 in two years. The 2008 financial crisis pushed it into the 20s and 30s. By comparison, the current decline from 112.8 to the mid-80s looks moderate on a historical chart. But the sustained nature of the decline matters more than its depth.
Consumer Confidence by Demographic: Age, Income, and Generation
The aggregate CCI reading hides dramatic variation across generations, income brackets, and political affiliations. The demographic splits in early 2026 are among the most extreme in the survey’s history.
Demographic Statistics
- Baby Boomers showed a job market differential of +14.9% in September 2025, meaning 14.9% more Boomers said jobs are “plentiful” than “hard to get.”
- Gen Z’s job market differential stood at just +2.1% in September 2025, compared to +3.6% for Millennials and +4.7% for Gen X.
- Republican respondents showed a Present Situation Index of 160.5 in late 2025, vs. 110.5 for Independents and 107.9 for Democrats.
- Consumers under 35 were the most optimistic demographic in early 2026, while those aged 35 and older showed the sharpest confidence declines.
- Lower-income consumers earning less than $50,000 annually turned net negative in their economic outlook in late 2025, while middle-income households ($50,000-$100,000) maintained the strongest overall readings.
Job Market Differential by Generation (September 2025)
% more respondents saying jobs are “plentiful” vs. “hard to get.” Source: The Conference Board
Baby Boomers+14.9%
Gen X+4.7%
Millennials+3.6%
Gen Z+2.1%
The Boomer vs. Gen Z gap is striking. Conference Board data from September 2025 shows Baby Boomers report a job market differential nearly seven times higher than Gen Z. For Boomers, jobs look plentiful because many are already in established careers or retired. For Gen Z, the job market feels tighter, entry-level roles are competitive, and wages haven’t kept pace with the cost of the lifestyle they’re entering.
The political split is equally pronounced. When identical economic conditions produce a Present Situation reading of 160.5 for one group and 107.9 for another, the index is measuring perception as much as reality. Both groups live in the same economy. Their different readings tell you how much political context shapes economic feelings.
Income matters too. Lower-income households under $50,000 turned net negative on their economic outlook in late 2025. These consumers are the most price-sensitive group in any market. They’re the ones most likely to change behavior when confidence drops. That means trading down to cheaper brands, cutting discretionary spending, and hunting much harder for deals before buying.
Consumer Confidence and Recession Prediction: What the Data Shows
The Expectations Index crossing below 80 is the CCI’s primary recession warning signal. As of February 2026, that threshold has been breached for 13 or more consecutive months.
Recession Signal Statistics
- Historically, the Expectations Index falling below 80 has signaled a recession within 6-12 months in most economic cycles.
- The Expectations Index has been below 80 for 13+ consecutive months as of February 2026, the longest sustained breach since the 2008 financial crisis period.
- The historical average CCI reading at the start of US recessions is 101.9, according to Advisor Perspectives citing Conference Board data. The US has been below that level since February 2025.
- The Cleveland Fed (2025) found that regional economic sentiment reliably predicted US recessions from the mid-1980s through the COVID-19 pandemic.
- The Brookings Institution’s foundational analysis found that consumer sentiment does forecast future changes in spending, with statistically significant predictive power relative to other economic indicators.
- Recession probability estimates in early 2026 ranged from 30% (S&P Global) to 49% (Moody’s Analytics).
But there’s a big caveat. The recession signal has been flashing for over a year while GDP growth stayed positive at roughly 2-3% in 2025. Researchers at the Harvard Belfer Center noted in April 2025 that Michigan Consumer Sentiment is a useful leading indicator. But the post-pandemic period has weakened that relationship. The gap between what people say and what they do has never been wider.
Here’s where it gets complicated. The classic recession-prediction model assumed consumers would cut spending when confidence dropped. That assumption held from the 1970s through 2019. Post-pandemic, it hasn’t. Consumers are reporting their worst sentiment readings in years while still spending at rates that support GDP growth. The CCI may be predicting the vibes of a recession. Not an actual one.
The Advisor Perspectives tracking of Conference Board data shows US confidence has been below the historical pre-recession average of 101.9 since February 2025 with no recession materializing. That’s not proof the signal is broken. It’s proof the relationship has become noisier.
⚠️
Attention: The Expectations Index below 80 is a historically reliable recession warning, but the post-pandemic economy has produced at least one false signal. Treat it as a risk indicator, not a certainty.
The Spending-Sentiment Paradox: Why Americans Keep Buying Despite Low Confidence
A Federal Reserve study published in April 2025 found something researchers had suspected but now confirmed with hard data: US consumers are buying more than their stated confidence levels would predict.
Spending-Sentiment Paradox Statistics
- A Federal Reserve Board study (April 2025, ~10,000 surveyed panelists linked to verified micro-spending data) found that consumers consistently reported feeling worse about the economy while verified retail spending stayed strong through 2024.
- The Federal Reserve concluded that “consumer sentiment surveys on their own have become weaker indicators of future consumer behavior” in the post-pandemic era.
- Survey respondents in the Federal Reserve study tended to overestimate the inflation they personally experienced. Those who overestimated inflation the most reported the worst feelings about the economy.
- Most respondents had higher 2024 incomes compared to 2019 but still reported that the economy “feels bad.”
- The Federal Reserve’s Survey of Household Economics and Decisionmaking (SHED 2024) found 73% of adults were “doing okay” or “living comfortably” financially, similar to the 72% seen the prior year.
- US GDP grew at roughly 2-3% in 2025 despite historically low CCI readings, further illustrating the gap between sentiment and behavior.
The Federal Reserve’s FEDS Notes study is blunt about what’s happening. Consumers aren’t just pessimistic about abstract economic conditions. They’re telling survey researchers that things are bad for them personally. But when researchers checked those same respondents’ actual spending records, the data told a different story. People say they can’t afford things and then buy them anyway.
Part of this is inflation psychology. The Fed study found that consumers consistently overestimate how much inflation they’ve actually experienced. A household that’s actually faced $200/month more in grocery and gas costs might feel like they’ve taken on $500/month in extra burden. That distorted perception drives down sentiment readings without reflecting what’s actually happening to spending power.
Tracking deals across thousands of stores, a pattern keeps showing up that fits this research. When consumer confidence drops and the economy feels uncertain, search traffic for coupon codes and discount pages spikes, but actual purchases don’t disappear. Shoppers get more deliberate about where they spend. They want the same items; they just want them at a lower price. Low CCI often means more promotional pressure from retailers, which means better deals for consumers who know where to look.
The same dynamic played out in the 1970s-early 1980s during the last extended period of inflation-driven pessimism. Sentiment crashed, but consumer spending never collapsed to match.
Retail Spending Data: How CCI Correlates with Consumer Purchases
Consumer spending drives roughly 65% of US GDP. When that spending stays resilient despite low confidence readings, it creates both economic puzzles and practical opportunities.
Retail Spending Statistics
- Consumer spending accounts for approximately 65% of US GDP, making confidence surveys among the most important leading indicators for the economy.
- The National Retail Federation forecasts retail sales growth of 4.4% year-over-year in 2026, targeting roughly $5.6 trillion in nominal retail sales.
- The Conference Board CCI rose to 121.2 in October 2025, up 6.3 points from September’s 115.0, coinciding with stronger-than-expected retail activity that month.
- Buying plans rose in February 2026 despite weak Expectations Index readings, suggesting households are separating near-term purchase decisions from longer-term economic worry.
- The Federal Reserve SHED 2024 survey found that 60% of adults said price changes had made their financial situation worse, down from 65% the prior year, suggesting a slow but real easing of inflation frustration.
The October 2025 data point is worth noting. The CCI popped to 121.2 in October, and retail activity followed. That correlation works, just not consistently. The National Retail Federation is projecting 4.4% growth for the full year, even with confidence at historically weak levels. That reinforces what the Fed study found. The relationship between CCI and actual spending has loosened.
So what does this mean practically? Retailers know that consumers are spending even when they say they won’t. That knowledge shapes promotional strategy. When confidence is low, the playbook shifts to get shoppers off the fence: steeper discounts, extended sale windows, more aggressive email promotions, and broader coupon distribution. The DontPayFull platform processes coupon data from thousands of stores. The pattern is clear: low-confidence periods drive higher promotional activity from retailers trying to convert hesitant shoppers.
What Low Consumer Confidence Means for Shoppers
Here’s the practical translation of everything above. Low CCI isn’t just a number on a chart. For deal-seekers, it creates specific market conditions worth understanding.
Shopper Behavior Statistics
- 26% of US adults reported using more coupons in 2024 specifically because of the state of the economy, per Prosper Insights & Analytics research for the National Retail Federation (July 2024).
- 3 in 5 US consumers said they were looking for promotional, discount, or coupon codes when shopping online, driven by inflation frustration.
- Lower-income consumers earning under $50,000 face the most negative confidence readings in the current environment, making deal-seeking behavior most concentrated in this group.
- When the CCI is low, retailers typically increase promotional activity to stimulate spending, creating better discount opportunities for consumers who track deals actively.
- Coupon and discount-seeking has shifted from an occasional tactic to a core shopping behavior in the current low-confidence environment, with most consumers checking for codes before completing purchases.
Research from Prosper Insights & Analytics published in July 2024 found that 26% of US adults are using more coupons directly because of economic uncertainty. That’s not a marginal increase. Three in five US consumers are actively looking for promotional codes when shopping online, a fundamental shift in how most people approach purchases.
What most guides miss is the flip side of this equation. When consumers become more coupon-conscious, retailers respond. Stores that previously relied on full-price sales shift promotional budgets, launch more sitewide events, and extend discount windows to capture spending from more cautious shoppers. The result: the current low-CCI environment has, somewhat paradoxically, created better deal conditions than a high-CCI environment where retailers can sell at full price more easily.
The income-stratified data makes this even more specific. Lower-income consumers are the most price-sensitive group in the current environment, they’re also the ones for whom a 15-20% discount has the largest practical impact. For shoppers in that bracket, staying on top of current deals across major retailers isn’t optional, it’s how household budgets survive when confidence is low and prices stay high.
From processing millions of coupon requests, we’ve observed that search activity for discount codes tends to climb in the weeks following a sharply negative CCI release. Consumers who read the news, feel more anxious about spending, and then look for ways to make purchases they need anyway without feeling like they’re being reckless. Coupons become the psychological permission slip that reconciles pessimism with necessity.
You can check current deals from major retailers on DontPayFull, or use our DontPayFull extension to automatically test available codes at checkout without having to manually search.
Global Consumer Confidence Index Statistics
The US CCI doesn’t exist in isolation. The OECD publishes a composite Consumer Confidence Index for member countries that uses a standardized amplitude-adjusted methodology, making international comparisons more meaningful than direct index comparisons.
Global Statistics
- The OECD CCI uses an amplitude-adjusted long-term average of 100, where readings above 100 indicate optimism and below 100 indicate pessimism relative to historical trends.
- The OECD composite CCI for the US stood at 60.89 in February 2026, up from 56.91 in December 2025, per FRED series USACSCICP02STSAM.
- OECD US CCI readings for recent months: 60.89 (Feb 2026), 60.68 (Jan 2026), 56.92 (Dec 2025), 54.87 (Nov 2025).
- The Ipsos Global Consumer Confidence Index showed improvement in June 2025 led by Asia-Pacific and European markets, before softening again in September 2025.
- By November 2025, Ipsos data showed sentiment recovery in Asia-Pacific and Latin America, suggesting regional divergence in post-pandemic confidence trajectories.
- International CCI variants include: Conference Board of Canada (since 1980), Bank of Indonesia (since 1999), and the KBC/ESRI Consumer Sentiment Survey for Ireland (since 1996).
The OECD data via FRED shows the US composite measure trending upward in early 2026 after bottoming in November 2025. The OECD’s amplitude-adjusted methodology smooths short-term volatility. That’s why the absolute numbers look different from the Conference Board’s 91.2 headline. Both indexes are measuring the same shift in sentiment, just through different lenses.
Low consumer confidence isn’t uniquely American. Multiple major economies have been navigating their own post-pandemic sentiment hangovers. Asia-Pacific markets recovered faster. Partly because their inflation cycles differed, but also because their consumer sentiment indexes started from different baseline conditions.
Methodology
The DontPayFull Research Team compiled this article using publicly available data from government agencies, academic institutions, and industry research organizations. All statistics are cited with their primary sources.
A note on data currency. Consumer confidence surveys are published monthly with minimal lag. The Conference Board releases CCI data within days of survey completion. The University of Michigan publishes preliminary readings mid-month with final readings by month-end. As of March 2026, the most current Conference Board data covers February 2026, and the most current Michigan Surveys data covers March 2026 (preliminary and final). OECD composite data lags by 1-2 months. FRED series UMCSENT is updated as new Michigan data is published. Government survey data from the Federal Reserve SHED covers the 2024 survey year (released May 2025) and reflects the latest available annual data at time of writing.
Primary data sources: The Conference Board Consumer Confidence Survey (monthly, since 1967). University of Michigan Surveys of Consumers (monthly, since November 1952, via FRED series UMCSENT). OECD Composite Leading Indicators via FRED (series USACSCICP02STSAM). Federal Reserve Board FEDS Notes (2025).
Secondary sources: Federal Reserve Survey of Household Economics and Decisionmaking (SHED, 2024, n=12,000+), conducted October 2024, released May 2025. Philadelphia Fed LIFE Survey (April 2025). Cleveland Fed Economic Commentary (2025). Advisor Perspectives Conference Board tracking. Brookings Institution analysis of consumer sentiment. UNC Kenan Institute expert roundtable (2024). National Retail Federation consumer behavior surveys. Prosper Insights data for NRF (July 2024).
The Bottom Line
The Consumer Confidence Index in early 2026 is telling a split story: the Present Situation Index at 120.0 says Americans feel okay about current conditions, but the Expectations Index at 72.0 signals persistent worry about the next six months, a level that has historically preceded recessions. The critical threshold to watch is the Expectations Index of 80. It’s been below that level for over a year. That said, the Federal Reserve’s 2025 research found that low CCI no longer reliably predicts spending declines in the post-pandemic era. Consumers overestimate inflation, feel worse than their finances warrant, and keep buying anyway. For shoppers, that dynamic has a practical upside: low-confidence periods drive more aggressive retailer promotions, higher coupon availability, and better overall deal conditions. The current environment is arguably one of the best in recent memory for consumers who shop strategically.
Frequently Asked Questions
What is considered a good Consumer Confidence Index number?
For the Conference Board CCI (1985=100), readings above 100 generally indicate consumers feel optimistic about current economic conditions. Readings in the 110-130 range signal solid confidence, as seen in mid-2021 and late 2024. Below 80 is widely considered a warning zone, particularly when the Expectations sub-index falls below 80, which has historically preceded recessions. For the OECD composite measure (long-term average=100), the same 100 threshold applies.
How often is the Consumer Confidence Index updated?
The Conference Board releases its CCI on the last Tuesday of every month at 10am Eastern Time. The University of Michigan’s Surveys of Consumers releases a preliminary reading mid-month and a final reading at month-end. Both provide monthly frequency data.
What is the difference between the CCI and the Michigan Consumer Sentiment Index?
Both measure consumer optimism, but the methods differ. The Conference Board surveys 5,000 households, focusing on employment and business conditions. Michigan surveys 500+ adults using 50 questions about personal finances, buying conditions, and economic expectations. Michigan dates to 1952 (baseline: 1966:Q1=100). The Conference Board started in 1967 using 1985=100. They often move together but can diverge, especially during politically charged periods when partisanship shapes how people interpret economic conditions.
How does the Consumer Confidence Index affect interest rates?
The Federal Reserve monitors CCI trends as part of its broader economic assessment. When confidence drops sharply, it signals potential consumer spending weakness, which can support arguments for rate cuts to stimulate the economy. When confidence is high and spending is strong, it can support rate holds or increases to prevent overheating. The relationship isn’t direct or formulaic, but CCI data is part of the Fed’s regular economic dashboard.
What factors cause consumer confidence to go up or down?
Employment conditions are the primary driver. When jobs are plentiful and wages are rising, confidence tends to climb. Inflation is the main depressant in the current cycle. Sustained high prices, even if moderating, keep confidence depressed because consumers anchor to the cumulative price increases they’ve experienced rather than the current inflation rate. Stock market performance, housing prices, interest rates, and geopolitical uncertainty all play secondary roles.
Can consumer confidence predict a recession?
Historically, yes. The Expectations Index falling below 80 has preceded recessions in most post-1980 cycles, and the average CCI at recession starts has been 101.9. But the post-pandemic era has complicated this relationship. The Federal Reserve’s 2025 research found the correlation between stated sentiment and actual spending behavior has weakened significantly. The current period of sub-80 Expectations readings with GDP growth intact is a case study in that divergence.
How does consumer confidence affect retail sales and stock markets?
Retail sales tend to follow CCI with a 1-3 month lag in normal cycles. When confidence drops, retailers see softer discretionary spending first, then potentially even staples if confidence stays low. Stock markets react to CCI releases because investor expectations about consumer spending drive earnings estimates. A sharply negative CCI can trigger sell-offs in consumer discretionary sectors, while a surprise positive reading can boost retail and consumer stocks. The spending-sentiment paradox documented by the Fed means this relationship has also become less predictable in recent years.
Data compiled by the DontPayFull Research Team based on publicly available data from government agencies, academic institutions, and industry research firms.
Sources
- The Conference Board Consumer Confidence Survey: Primary source for CCI monthly readings, sub-indexes, demographic breakdowns (2026)
- University of Michigan Surveys of Consumers: Primary source for Michigan Consumer Sentiment Index monthly readings (2026)
- FRED UMCSENT Series – Federal Reserve Bank of St. Louis: Historical Michigan Consumer Sentiment time series data (1952-2026)
- FRED USACSCICP02STSAM – OECD US Composite CCI: OECD amplitude-adjusted consumer confidence for the United States (2025-2026)
- Federal Reserve FEDS Notes – Tracking Consumer Sentiment vs. Verified Retail Purchases: Study linking stated sentiment to verified spending behavior, n=10,000 (April 2025)
- Federal Reserve Survey of Household Economics and Decisionmaking (SHED): Annual household financial health survey, n=12,000+ (2024)
- Cleveland Fed Economic Commentary – Forecasting US Recessions: Regional economic sentiment as recession predictor (2025)
- Brookings Institution – The Predictive Power of the Index of Consumer Sentiment: Foundational econometric analysis of ICS predictive validity
- Advisor Perspectives – Conference Board Consumer Confidence Index: Tracking pre-recession CCI averages and threshold analysis (2025)
- Harvard Belfer Center – How to Forecast a Recession: Consumer sentiment as recession leading indicator analysis (April 2025)
- UNC Kenan Institute – Consumer Sentiment vs. Economic Indicators: Expert roundtable on UM vs. Conference Board divergence (2024)
- Conference Board Demographic CCI Data – PR Newswire: Generational job market differential data (September 2025)
- eMarketer/Prosper Insights & Analytics – Coupon Usage Statistics: 26% of US adults using more coupons due to economy (July 2024)
- Retail Customer Experience – Inflation Frustration and Coupon Use: 3 in 5 consumers seeking promotional codes when shopping online (2024)
- Valdosta CEO / Conference Board via NRF: Demographic divides in US consumer confidence (October 2025)
Do You Have Any Suggestions?
We're always looking for ways to enrich our content on DontPayFull.com. If you have a valuable resource or other suggestion that could enhance our existing content, we would love to hear from you.
Was this content helpful to you?
Related Articles