No votes yet.

Mobile Coupon Statistics 2026: Usage, Redemption Rates, and App Trends
Updated 2026 mobile coupon statistics: 169M US redeemers, 93.5% via smartphone, 10x higher redemption vs paper. Covers app trends, SMS performance, and which channels work best.
Something shifted in the way Americans save money, and it happened faster than most retailers expected. The digital coupon market hit $10.6 billion in 2025 and is on track to cross $12.55 billion by 2026. That’s not a niche trend. That’s a structural change in how coupons work, and smartphones are driving every bit of it.
Key Takeaways
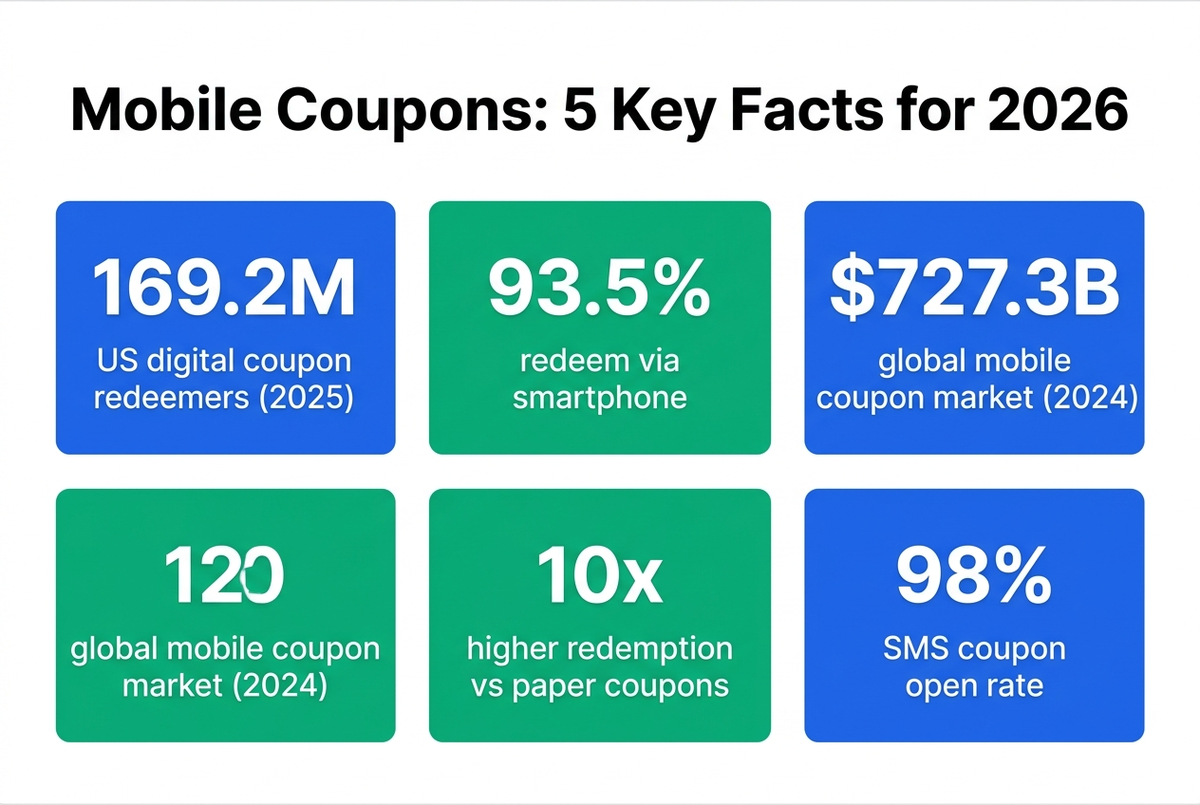
- ✓ 93.5% of digital coupon users now redeem via smartphone – up from just 85.5% in 2020, a shift that took less than five years.
- ✓ The global mobile coupon market reached $727.3 billion in 2024 and is projected to hit $1.6 trillion by 2030 at a 14.6% annual growth rate.
- ✓ Mobile coupons have a 10x higher redemption rate than paper coupons, with digital averaging 5.92-10% vs. under 1% for print FSIs.
- ✓ Gen Z leads adoption at 78% digital coupon use, but even Baby Boomers have grown their digital coupon usage by roughly 40% since 2020.
- ✓ SMS coupons hit a 98% open rate and 5-15% redemption rates – the highest-performing coupon delivery channel by a wide margin.
Mobile Coupon Usage Overview: How Big Is the Market?
169.2 million Americans redeemed digital coupons in 2025, and the smartphone is now the primary tool for doing it. The US market has grown dramatically: roughly 80 million adults redeemed digital coupons back in 2018. By 2023, that number crossed 145 million. That’s 81% growth in five years, and the trajectory hasn’t flattened.
Mobile Coupon Usage Statistics
- 169.2 million Americans redeemed digital coupons in 2025, up from about 80 million in 2018 – representing 81% growth in seven years.
- Mobile coupon users reached 1.1 billion worldwide in 2023, with the market projected to grow at a compound annual rate of 18.9% through 2030.
- 93% of all Americans have used a coupon or are current coupon users, reflecting couponing’s near-universal appeal across income levels.
- 62% of US consumers actively search for promo codes and coupons when shopping online, up from under half a decade ago.
- 82% of smartphone users have used a mobile coupon in the past year, making mobile the dominant coupon format for active deal seekers.
- US mobile coupon downloads reached 8.5 billion in 2023, up 25% year-over-year, a figure that reflects both new user adoption and growing engagement from existing users.
- 26% of US consumers reported using more coupons in 2024 than the prior year, indicating continued demand growth even as overall adoption matures.
Worldwide, 1.1 billion people now use mobile coupons, and that number is growing at roughly 18.9% per year. To put the US figure in context: 93% of all Americans use coupons at some point. The digital share of that is now the majority.
What’s driving this? Smartphones made coupon use effortless. Finding a deal used to mean flipping through newspaper inserts or clipping physical coupons. Now 62% of US consumers search for promo codes mid-session when shopping online, often in under 30 seconds. The friction is almost gone.
One thing we steadily notice across the thousands of coupon codes tracked on our platform: the gap between “found a code” and “used a code” has collapsed. Browser tools and retail apps have made it nearly instant, which is a big part of why redemption numbers have climbed so sharply. It’s not just that more people have smartphones. It’s that using a coupon on a smartphone is now actually easier than not using one.
Mobile Coupon Market Size and Growth Projections
The global mobile coupon market was valued at $727.3 billion in 2024, up 15.4% year-over-year. The US slice of that was $199.0 billion, up 14% from the prior year. These aren’t small numbers. And the growth projections are even more striking.
Market Size Statistics
- The global mobile coupon market was valued at $727.3 billion in 2024, growing 15.4% year-over-year from 2023.
- The US mobile coupon market reached $199.0 billion in 2024, reflecting a 14% increase from the previous year.
- Global market projections place the mobile coupon industry at $1.6 trillion by 2030, implying a compound annual growth rate of 14.6%.
- The digital coupon software and platform segment (the technology layer) was valued at $10.6 billion in 2025 and is projected to reach $12.55 billion by 2026.
- The broader digital coupon market is forecast to grow at a 18.33% CAGR through 2032, reaching $34.43 billion by the end of that period.
- China is the fastest-growing national mobile coupon market at 19.4% CAGR, followed by Canada (13.3%), Germany (12.5%), and Japan (11.3%).
The market-size figures from research firms differ based on scope. The $727.3 billion figure (ResearchAndMarkets) captures total commerce done through mobile coupon channels. The $10.6 billion figure (Business Research Insights) covers the software and platform layer only. Both numbers are real. They measure different things. Here’s what both agree on: the market is large and growing fast.
The table below traces the digital coupon platform segment’s growth trajectory through 2032:
| Year | Global Digital Coupon Market (Platform Layer) | YoY Growth |
|---|---|---|
| 2023 | $7.57 billion | – |
| 2024 | $8.96 billion | +18.4% |
| 2025 | $10.6 billion | +18.3% |
| 2026 (projected) | $12.55 billion | +18.4% |
| 2032 (projected) | $34.43 billion | +18.33% CAGR |
Source: Business Research Insights / DemandSage, 2026
Mobile vs. Paper Coupon Redemption Rates
Mobile coupons have a 10x higher redemption rate than traditional paper coupons, with digital averaging 5.92-10% versus under 1% for print. That gap isn’t closing anytime soon. The average digital coupon redemption rate hit 5.92% in 2024, up 12.8% from 2023.
Redemption Rate Statistics
- The average digital coupon redemption rate reached 5.92% in 2024, up 12.8% year-over-year from 2023.
- Mobile coupons have a 10x higher redemption rate than traditional paper coupons, per Juniper Research analysis.
- SMS coupon redemption rates range from 5% to 15% industry-wide, with personalized time-sensitive offers occasionally reaching 30-60%.
- Push notification coupons achieve a 15% click-through rate vs. 2% for email in retail apps, reflecting the advantage of native mobile delivery.
- QR-based mobile offers achieve redemption rates of 7-10% when well-targeted, compared to under 1% for standard printed FSI coupons.
- 82% of consumers redeem a digital coupon within one week of receiving it; 30% redeem within 24 hours – far faster than paper equivalents.
- 65% of digital coupons scanned via mobile were redeemed instantly in 2023, reflecting the shift to point-of-sale coupon use.
The comparison table below summarizes redemption rates by coupon type and delivery channel:
| Coupon Type / Channel | Average Redemption Rate | Notes |
|---|---|---|
| Paper FSI (Sunday inserts) | <1% | Long-declining format |
| Email coupon | 3.2% | Varies significantly by personalization |
| Digital coupon (average) | 5.92% | 2024 average, up 12.8% YoY |
| QR code coupon | 7-10% | When well-targeted at relevant moments |
| SMS coupon | 5-15% | Top of the range for personalized, time-limited offers |
| Push notification coupon | 15% CTR (retail apps) | Click-through, not final redemption |
| Personalized SMS (time-limited) | 30-60% | Best case scenario with strong targeting |
Sources: Capital One Shopping Research, Sakari, Gitnux, Juniper Research
Here’s something most coupon guides won’t tell you: the redemption rate edge of mobile isn’t just about ease. It’s about timing. A push notification lands when a shopper is already on their phone. An SMS arrives while they’re near a store. A QR code shows up right at the point of purchase. Paper coupons have none of that. They require the shopper to bring them, find them in a drawer, and remember to use them at checkout. Every extra step cuts the redemption rate. Mobile removes nearly all of them.
Smartphone Coupon Adoption by Year
The smartphone’s dominance in coupon redemption didn’t happen overnight. The table below tracks how the share of digital coupon users redeeming via smartphone has grown each year:
| Year | Share Redeeming via Smartphone |
|---|---|
| 2020 | 85.5% |
| 2021 | 89.3% |
| 2022 | 91.5% |
| 2023 | 92.3% |
| 2024 | 93.0% |
| 2025 (projected) | 93.5% |
| 2026 (projected) | 93.8% |
Source: Capital One Shopping Research / DemandSage, 2026
Tablet usage has stayed flat at roughly 42% over the same period. Laptops still get used for research, but the actual coupon redemption moment has migrated almost entirely to smartphones. By the time 53.4% of all US coupons redeemed in 2024 were digital – a first-ever majority – it wasn’t a surprise. The systems had been building for years.
Mobile Coupon Demographics: Who Uses Them Most?
Gen Z uses digital coupons at a higher rate than any other generation, with 78% of those born after 1996 redeeming digital coupons in 2024. Millennials follow at 77%. But the more interesting story is the Boomer movement: Baby Boomers have grown their digital coupon usage roughly 40% since 2020. Digital couponing is no longer a young person’s game.
Demographic Statistics
- 78% of Gen Z consumers (born after 1996) redeemed digital coupons in 2024, the highest adoption rate of any generation.
- 77% of millennials used digital coupons in 2024, making them a close second and the most likely to impulse-purchase due to a digital offer (41%).
- 68% of Gen X consumers used digital coupons in 2024, reflecting steady adoption by a generation that grew up with print formats.
- 56% of Baby Boomers used digital coupons in 2024, up roughly 40% from their 2020 adoption rate, making them the fastest-improving demographic.
- Women download digital coupons via smartphone more often (48%) than men (35%) during in-store shopping trips.
- Households earning $50,000-$100,000 per year are the most active digital coupon users, though 27% of households earning $150,000+ also redeem them regularly.
- 41% of millennials have made an impulse purchase due to a digital coupon, compared to 27% of Gen X and 19% of Gen Z.
The impulse purchase data is worth pausing on. Millennials are the most likely to act on a coupon they weren’t planning to use, at 41%. Gen Z, despite leading in digital use, impulse-buys less from coupons at 19%. That gap likely reflects different money habits. Gen Z grew up during tight times and tends to use coupons with a plan. Millennials with more spending power are more likely to grab a deal they didn’t expect to find.
One pattern we see repeatedly in deal-tracking data: the households that clip the most coupons aren’t always the lowest-income ones. Middle-income shoppers in the $50-100K range tend to be systematic about it. They’ve built coupon habits into their routine, they use apps steadily, and they’re more likely to combine multiple savings methods at checkout. Higher earners, by contrast, often use coupons opportunistically when they’re easy to find.
Digital Coupon Usage by Generation (2024)
Share of each generation that redeemed digital coupons in 2024
Gen Z (born after 1996)78%
Millennials77%
Gen X68%
Baby Boomers56%
All generations trending up: even Boomers grew ~40% since 2020
Most Popular Mobile Coupon Apps
The most-downloaded mobile discount app in the US pulled in 12.4 million downloads, and the top grocery reward scanner hit 40 million total users. The coupon app ecosystem has consolidated around a handful of dominant players, each with a different core use case.
Coupon App Statistics
- The top mobile discount app in the US recorded 12.4 million downloads in 2024, making it the most-downloaded coupon app in the country.
- The second-most-downloaded US coupon app recorded 8.65 million downloads in the same period, narrowing the gap from prior years.
- The leading grocery receipt-scanning rewards app has amassed 40 million+ total users, cementing its dominance in the grocery category.
- Too Good To Go was the most-downloaded deal app globally in 2024 with 23 million downloads worldwide, per Statista.
- Groupon maintains 24 million+ active customers globally for local experiences and dining deals.
- 43% of consumers find coupons through mobile apps; 48% use search engines and 44% use coupon websites – meaning apps are closing in on search as a primary discovery channel.
- 32% of online shoppers use a browser extension for automated digital coupons at checkout, reflecting strong demand for hands-free saving.
The split between receipt-scanning apps, browser extensions, and retailer apps matters in practice. Receipt-scanning apps work best for grocery and household products. You snap a photo of your receipt and get cashback. Browser extensions are strongest for online shopping, where they test codes at checkout on their own. Retailer apps give the biggest discounts on that store’s items, but you have to shop there.
💡
Tip: If most of your shopping happens at a handful of online retailers, a browser extension covers more of your spending with less effort than juggling multiple store apps. For grocery and in-store shopping, receipt-based apps tend to pay back better per trip.
There’s a bigger point here too. From tracking coupon use across hundreds of stores, a pattern keeps showing up: shoppers who use a browser tool and a rewards app together save at more points in the purchase. The app handles loyalty and cashback. The browser tool catches promo codes. They don’t compete. They cover different moments in the same checkout.
SMS Coupon Statistics: Open Rates, Redemption, and Performance
SMS coupons achieve a 98% open rate, with 90% read within 3 minutes of receipt. That’s not a typo. No other marketing channel comes close. Email sits at 20-28% open rates on a good day. Push notifications get ignored. But SMS? People read it almost immediately, nearly every time.
SMS Coupon Statistics
- SMS coupons achieve a 98% open rate, with 90% of messages read within 3 minutes of delivery – the highest open rate of any marketing channel.
- SMS coupon redemption rates range from 5% to 15%, compared to 1-5% for email coupons – a 3-10x performance advantage.
- SMS marketing delivers an average ROI of $71 for every $1 spent, one of the strongest returns of any direct marketing channel.
- 32% of consumers respond to SMS promotional offers, and 80% of businesses now use SMS marketing software.
- 70% of businesses planned to increase their SMS marketing budget in 2025, indicating industry confidence in the channel’s performance.
- SMS coupons are redeemed at 10x the rate of traditional coupons when delivered with proper targeting and timing.
- Personalized, time-limited SMS offers can push redemption rates to 30-60% in optimal conditions – making them the highest-performing promotional format available.
The table below shows how SMS compares to email and push notifications on key metrics:
| Metric | SMS | Push Notification | |
|---|---|---|---|
| Average open rate | 98% | 20-28% | 50-60% (shown rate) |
| Read within 3 minutes | 90% | <5% | Varies |
| Avg. redemption rate | 5-15% | 1-5% | ~15% CTR (retail apps) |
| ROI per $1 spent | $71 | $36-42 | Not standardized |
| Opt-out friction | Low (reply STOP) | Low (unsubscribe link) | Medium (settings) |
Sources: Sakari, Klaviyo/Omnisend, Gitnux app analytics data
So why doesn’t everyone just use SMS? Two reasons. First, building an SMS list is harder than email. Shoppers must opt in to receive texts. Second, volume has to stay low or people unsubscribe fast. A retailer that texts every day will see its list shrink. Brands that do it well send 4-8 texts per month, and they make each one count.
Push Notification and In-App Coupon Statistics
Push notification coupons achieve a 15% click-through rate in retail apps, compared to about 2% for email. That’s a significant advantage, and it’s driven by context: push notifications appear on the lock screen right where users are already looking, at the moment when they’re potentially most receptive to an offer.
Push Notification Statistics
- Push notification coupons in retail apps achieve a 15% click-through rate vs. about 2% for email, per 2023 app analytics benchmarks.
- Mobile push targeting increases coupon redemption rates by 6% over passive “pull” coupon methods, per a 2024 Information Systems Research journal study.
- Personalized behavioral push notifications lifted conversions by up to 54% and reduced cart abandonment by 22% when deployed at the right moment.
- Retail app push notifications average 3.05% CTR on iOS and 3.78% CTR on Android; promo-code-specific pushes reach 16-18%.
- 45% of digital coupon redemptions are now driven by push notifications, making them the primary delivery trigger for in-app offers.
- Users who receive push notifications show 13-39% higher purchase frequency compared to app users who haven’t enabled them.
- In-app coupon mechanisms drove 45% of app revenue via discounts in 2023, underscoring how central mobile promotions have become to app monetization.
The 54% lift from personalized push notifications is a real number. But “personalized behavioral” isn’t a generic cart reminder. It’s a push that fires based on what a user actually did: browsed a section, viewed an item three times, added something to their wishlist. The offer is matched to that action. Generic pushes perform far worse. The brands hitting these numbers work hard on targeting.
QR Code Coupon Statistics
QR code coupons accounted for 35% of digital coupon redemptions in retail in 2023, and the format has only grown since. The pandemic normalized QR code scanning behavior across all age groups, and retailers have been capitalizing on it for coupons ever since.
QR Code Coupon Statistics
- 84% of mobile users have scanned a QR code at least once, and roughly one-third scan QR codes on a weekly basis.
- QR code coupons accounted for 35% of all digital coupon redemptions in retail in 2023, making it the second-largest digital redemption channel.
- More than 5.3 billion coupon codes were redeemed via QR codes between 2022 and 2025, reflecting rapid adoption of the format at point of sale.
- QR-based mobile offers achieve redemption rates of 7-10% when deployed in relevant, high-intent contexts such as product packaging and in-store signage.
- NFC-based mobile coupons grew 40% to 150 million uses in Europe in 2023, signaling parallel growth in tap-to-redeem coupon formats.
- Mobile wallet coupon loads (via Apple Pay and Google Pay) hit 500 million in the US in 2023, adding another digital-physical bridge for mobile offers.
QR coupons work best when placed where someone is already close to buying: on the product itself, at shelf-edge signs, or on a receipt pushing a next visit. The worst QR coupons are generic ones by the front door with no clear offer tied to them. The 7-10% redemption rate for well-placed QR coupons beats the digital average. That’s why retailers keep using them.
🤔
Did You Know: Over 5.3 billion coupon codes were redeemed via QR codes between 2022 and 2025 – a volume that would have seemed implausible just a few years ago when QR codes were considered a failed technology.
In-Store Mobile Coupon Behavior
35% of consumers use digital coupons while actively shopping in-store, and the share is climbing. Mobile has quietly become a companion to physical retail, not a replacement for it.
In-Store Mobile Statistics
- 35% of US consumers used digital coupons while shopping in-store in 2025, a figure that has grown steadily since smartphones became everywhere.
- 41% of consumers use their smartphones to check for deals and compare prices while physically inside a store.
- More than 75% of general consumers and 93% of millennials use mobile in-store to look for coupons before or during a purchase decision.
- 69% of brand-loyal shoppers have switched brands based on a discount notification received on mobile while inside a store.
- 57% of consumers visited a business after receiving a location-based mobile offer near that location, per geofencing campaign data.
- Geofencing coupon campaigns increase store foot traffic by 18-29% on average, and 65% of consumers say they’re more likely to visit a store after a relevant geofence-triggered alert.
- 50% of US consumers want immediately redeemable discounts pushed to their phones while they’re inside a store – demand that still exceeds current retail deployment.
The 69% brand switching figure is worth sitting with. Nearly seven in ten brand-loyal shoppers will switch to a rival if they get a better mobile offer while standing in the store. That’s a big deal for brand managers. Loyalty is less durable than it used to be when a rival’s coupon can show up on a phone at the moment of decision.
Geofencing has become the most interesting in-store mobile coupon format. An 18-29% foot traffic lift is a strong result for any retail campaign. The idea is simple: when a shopper’s phone crosses into a set area near the store, an offer fires. But it takes real investment in location data tools, which is why big chains use it far more than small retailers.
Digital vs. Paper Coupon Distribution and Redemption Trends
Digital coupons now account for 53.4% of all US coupon redemptions, crossing the majority threshold for the first time in 2024. Paper coupons still represent 40.8% of redemptions, but the trend line is clear: digital has overtaken print.
Digital vs. Paper Trend Statistics
- Digital coupons accounted for 53.4% of all US coupons redeemed in 2024, crossing the majority threshold for the first time ever.
- Paper coupons represented 40.8% of redemptions in 2024, declining at about 5.61% per year.
- Digital coupon distribution grew 68.8% year-over-year in 2024, while paper coupon distribution fell 12.8% in the same period.
- Digital coupons accounted for 26.5% of all coupons issued in 2024 – still a minority of supply, but growing fast.
- 67% of US consumers use digital coupons, compared to 59% who use physical paper coupons – the first year digital has led in user adoption as well.
- Americans use digital coupons at a 13.6% higher rate than print coupons, measured by active user frequency.
- A total of 465.5 million digital coupons were redeemed in 2024, up 10.8% from 420.2 million in 2023.
The digital vs. paper crossover is real, but the full picture is more layered. Paper still makes up 40.8% of redemptions partly because grocery and household goods are slower to go digital than clothing or electronics. Many older shoppers still use physical inserts out of habit. But as more of them pick up smartphones and grocery apps with digital clip features, the paper share will keep falling.
| Year | Digital Share of Redemptions | Paper Share of Redemptions |
|---|---|---|
| 2020 | ~33% | ~60% |
| 2021 | ~38% | ~56% |
| 2022 | ~44% | ~51% |
| 2023 | ~49.5% | ~43% |
| 2024 | 53.4% | 40.8% |
Sources: Capital One Shopping Research / Inmar Intelligence. 2020-2023 figures extrapolated from trend data.
Mobile Coupon Savings Statistics
71% of digital coupon users save at least $10 per month, and 36% save $25 or more. Those numbers add up over a year. An active digital coupon user can reasonably expect to save several hundred dollars annually if they’re consistent about it.
Consumer Savings Statistics
- 71% of digital coupon users save at least $10 per month; 36% save at least $25 per month through digital coupons.
- Consumers who actively use digital coupon codes saved an average of $1,465 per year in 2021, representing about 6.4% of average household spending.
- The average checkout savings when using an online coupon code is about $30, or a 17.2% average discount on the purchase.
- Grocery shoppers using digital coupons save an average of 15.8% per purchase, with a 45.9% success rate for finding a valid code.
- Grocery-focused digital coupon users save an average of $395.81 per year specifically on grocery purchases.
- Households with children save 10.2% more using digital coupons than households without, likely due to higher baseline grocery and household spending.
- 40% of all online purchases can be matched with a working coupon code when shoppers take the time to search.
The 40% figure is worth noting. Four in ten online purchases can use a coupon code, but most shoppers don’t look for one. That’s the gap that browser tools and coupon sites try to close. The code often exists. The problem is finding it. What most guides skip over: even a search that fails half the time is worth doing, because when it works, you’re saving $15-30.
Mobile Coupon Effectiveness for Retailers
64% of retail media decision-makers view digital coupons as highly effective for boosting sales, and 67% of US CPG brand advertisers believe coupons will play a key role going forward. Mobile coupons aren’t just a shopper tool. For retailers, they’re one of the most measurable promotional formats available.
Retailer Effectiveness Statistics
- 64% of retail media decision-makers rate digital coupons as highly effective for driving incremental sales, according to eMarketer research.
- 67% of US CPG brand advertisers believe digital and physical coupons will play a key role in their future retail media strategies.
- 37% of online retailers currently offer mobile-only coupons exclusively through their branded apps, incentivizing app downloads alongside the discount.
- 86% of online shoppers are more likely to try a new business for the first time because of a coupon offer.
- 71% of consumers have switched brands because of a coupon – making coupons one of the most powerful competitive acquisition tools in retail.
- 85% of online shoppers have abandoned a shopping cart because they couldn’t find a working coupon code they expected to exist.
- Promotional emails featuring a coupon earn retailers an average of 48% more revenue than other types of promotional messages.
The 85% cart abandonment figure is one of the most useful stats here. Nearly nine in ten online shoppers have bailed on a cart because they couldn’t find a code they expected to exist. That’s real, recoverable revenue. A Mondelez study found that 14% of shoppers who opened a mobile coupon redeemed it in-store, vs. 2-3% for email. That’s a 5-7x difference. Format and timing matter a lot.
Social Media and Mobile Coupon Discovery
34% of consumers find coupons through social media, and among Gen Z that number climbs to 55%. Social platforms have become a primary coupon discovery channel, particularly for younger shoppers who spend more time on feeds than in search engines.
Social Discovery Statistics
- 34% of consumers discover coupons through social media; 51% use couponing blogs and social media accounts specifically to source deals.
- Facebook is the most popular social platform for coupon discovery, with 54% of Americans using it to find coupon offers.
- YouTube (32%) and Instagram (31%) rank second and third for coupon discovery; TikTok and Pinterest each contribute at 21%.
- 55% of Gen Z consumers discover coupons via social media, compared to just 22% who find them via email – reflecting a fundamental generational difference in channel preference.
- 59% of Facebook coupon seekers are 45 or older, while 59% of Instagram coupon seekers are under 45 – platform demographics matter for retailer targeting decisions.
- 90% of millennials share deals they find, and 43% do so through social media specifically, creating organic word-of-mouth amplification for coupon campaigns.
The platform age skew matters for retailers building coupon campaigns. Facebook reaches the 45+ shopper. Instagram skews younger. TikTok is younger still. And the 90% millennial deal-sharing rate means a great offer doesn’t just convert the person who finds it. They’ll send it to a friend too. Viral coupon campaigns are real on social. The mechanics are just the same sharing behavior millennials apply to anything worth passing on.
Methodology
This article compiles mobile coupon statistics from publicly available industry research published between 2023 and 2026. Primary sources include Capital One Shopping Research, eMarketer/Insider Intelligence, Inmar Intelligence, ResearchAndMarkets, Business Research Insights, Juniper Research, Statista, Gitnux, DemandSage, Sakari, and WifiTalents.
A note on data currency: most consumer behavior surveys and market sizing reports are published 6-18 months after the reference period closes. Sources cited as “2024 data” were typically published in late 2024 or early 2025. Where this article cites “2025 projected” or “2026 projected” figures, those are the source’s own forward estimates, not DontPayFull projections.
Market size figures vary across research firms due to how they define “mobile coupon market.” The $727.3 billion figure (ResearchAndMarkets) covers total commerce run through mobile coupon channels. The $10.6 billion figure (Business Research Insights) covers only the software and platform layer. Both are cited with proper context. Statistics are US-based unless labeled as global.
Our team tracks coupon codes and deal patterns across thousands of stores continuously. The analysis and interpretation in this article reflects both the cited research and our own ongoing observation of how coupon behavior evolves in practice.
The Bottom Line
Mobile has permanently changed how coupons work. The smartphone is now the dominant redemption device (93.5% of digital coupon users), and digital coupons crossed the majority threshold in 2024 at 53.4% of all US redemptions. The performance advantage is real and large: mobile coupon redemption rates run 5.92-10% on average vs. under 1% for print, with SMS delivering up to 15% redemption and ROI of $71 per dollar spent. If you’re a shopper, the practical takeaway is that looking for a digital coupon before any online purchase is worth the few seconds it takes, because 40% of purchases can be matched with a valid code. If you’re a retailer or marketer, the data points clearly toward SMS for highest conversion, push notifications for in-app engagement, and QR codes for in-store bridge moments. The app ecosystem will keep thinning out to, the market will keep growing, and paper coupons will keep declining. The mobile coupon era isn’t coming. It’s here.
Frequently Asked Questions
How many people use mobile coupons in the US?
169.2 million Americans redeemed digital coupons in 2025, up from roughly 80 million in 2018. The broader figure for mobile-specific use is tied to smartphone coupon adoption: 93.5% of digital coupon redeemers use a smartphone as their primary device. Globally, mobile coupon users exceeded 1.1 billion in 2023.
What is the redemption rate for mobile coupons compared to paper?
Mobile coupons average a 5.92-10% redemption rate, compared to under 1% for paper FSI coupons. SMS-delivered coupons perform best at 5-15%, with personalized time-limited offers reaching 30-60%. The 10x advantage of mobile over paper reflects the removal of friction at the point of redemption.
What is the mobile coupon market worth in 2024?
The global mobile coupon market was valued at $727.3 billion in 2024, with the US representing $199 billion of that. The digital coupon platform segment (SaaS and software tools specifically) was valued at $8.96 billion in 2024 and is projected to reach $10.6 billion in 2025 and $12.55 billion in 2026.
How effective are SMS coupons compared to email coupons?
SMS coupons clearly beat email on every key metric. SMS open rates hit 98% (vs. 20-28% for email), 90% of SMS messages are read within 3 minutes, and SMS redemption rates run 5-15% versus 1-5% for email. SMS marketing also delivers roughly $71 ROI per $1 spent, compared to $36-42 for email.
Which generation uses mobile coupons the most?
Gen Z has the highest digital coupon adoption at 78% in 2024, edging out millennials at 77%. However, the fastest-growing demographic is Baby Boomers, who have grown their digital coupon usage roughly 40% since 2020 and now sit at 56% adoption.
What percentage of coupons are now digital?
Digital coupons accounted for 53.4% of all US coupon redemptions in 2024, crossing the majority threshold for the first time. They represented 26.5% of all coupons issued, up 68.8% year-over-year. Paper coupons still make up 40.8% of redemptions, but that share is declining at roughly 5.61% per year.
Do mobile coupons work in physical stores?
Yes. 35% of US consumers use digital coupons while physically inside a store. QR codes, mobile wallet passes, and app-based loyalty coupons are all designed for in-store redemption. Geofencing campaigns (which push offers when shoppers are near a store) increase foot traffic by 18-29% on average.
How does geofencing work with mobile coupons?
Geofencing defines a virtual perimeter around a geographic location. When a shopper’s smartphone enters that zone, a triggered offer is pushed to their device. Geofencing campaigns increase foot traffic by 18-29%, and 65% of consumers say they’re more likely to visit a store after receiving a relevant geofence-triggered alert. 57% have actually visited a business after receiving such an offer.
Are browser extension coupons better than coupon apps?
They serve different use cases. Browser extensions work best for online shopping, automatically testing codes at checkout without manual search. Coupon and rewards apps are better for grocery, in-store shopping, and receipt-based cashback. Active savers often use both: an extension for online purchases and a rewards app for in-store trips. If you want a single tool that handles online checkout automatically, a browser extension removes the manual search entirely.
Which coupon app saves the most money?
The answer depends on where you shop. The top grocery receipt-scanning app has 40 million users and strong cashback rates for CPG. The leading mobile discount app (12.4 million US downloads) focuses on broader retail. Browser extensions perform well for online retail across categories. There’s no single winner for all shopping types.
Data compiled by the DontPayFull Research Team based on publicly available data from government agencies, academic institutions, and industry research firms.
Sources
- DemandSage Coupon Statistics 2026: Comprehensive coupon and digital redemption statistics including smartphone adoption trends (2026)
- WifiTalents Mobile Coupon Data Report 2026: Mobile coupon user counts, market projections and savings statistics (2026)
- Business Research Insights Digital Coupons Market: Digital coupon market size, CAGR, and growth projections through 2032 (2024)
- ResearchAndMarkets / GlobeNewswire: Global and US mobile coupon market valuation ($727.3B), CAGR forecasts through 2030 (2024)
- Capital One Shopping Research: US digital coupon redemption totals, smartphone share, generational breakdown, app rankings (2024-2025)
- Inmar Intelligence: Digital vs. paper coupon redemption share data, distribution figures (2024)
- eMarketer / Insider Intelligence: Retail media decision-maker effectiveness ratings, consumer spending on digital (2024)
- Juniper Research: 10x mobile vs. paper redemption rate benchmark (2013, widely cited)
- Sakari / Yotpo / Codebroker: SMS coupon open rate (98%), redemption rate benchmarks, ROI data (2024)
- Klaviyo / Omnisend: SMS marketing ROI of $71 per $1 spent (2025)
- Statista: Too Good To Go global downloads ranking (2024)
- Gitnux market reports: QR code coupon redemption share, push notification CTR benchmarks, mobile wallet loads (2023)
- Information Systems Research journal: Push notification targeting lift on coupon redemption (2024)
Do You Have Any Suggestions?
We're always looking for ways to enrich our content on DontPayFull.com. If you have a valuable resource or other suggestion that could enhance our existing content, we would love to hear from you.
Was this content helpful to you?
Related Articles