5.00 out of 1 votes
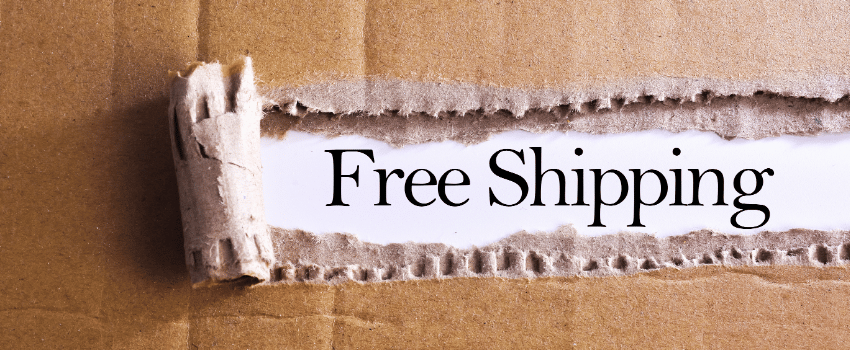
Free Shipping Statistics 2026: How Shipping Costs Affect Online Shopping
Free shipping statistics for 2026: covering consumer expectations, cart abandonment data, retailer adoption rates, and how shipping costs shape buying decisions. Discover why 66% of shoppers demand free shipping on every order and what it takes to avoid paying for delivery.
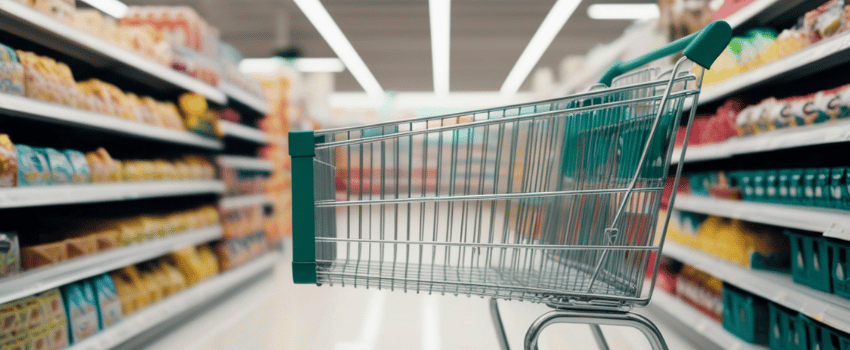
You’ve been there. Your cart is at $37, the shipping calculator says $8.95, and suddenly you’re browsing for something to push the total past the free shipping line. A phone case. Extra socks. Maybe a kitchen gadget you’ll never unbox. That instinct to dodge shipping fees isn’t a quirk. It’s one of the strongest forces in online shopping. The data from 2025 and 2026 shows just how much it shapes the way people buy.
Our team tracks shipping deals and promo codes across thousands of stores. One finding stands out year after year: free shipping codes get used at higher rates than percent-off coupons for the same stores. The stats below show why shipping has become the single biggest factor in buying choices online.
Key Takeaways
- ✓ 66% of consumers expect free shipping on ALL orders, but only 42% of US ecommerce transactions actually include it, a 24-point expectation gap
- ✓ Shipping costs cause 48% of all cart abandonments, making extra fees the single biggest reason shoppers bail at checkout
- ✓ Free shipping boosts average order value by 30% and lifts conversion rates by 20% or more across ecommerce
- ✓ Baby Boomers are 3.75x more likely than Gen Z to believe shipping should always be free (30% vs 8%)
- ✓ Last-mile delivery now eats 53% of total shipping costs, up from 41% in 2018, squeezing retailer margins harder every year
Free Shipping Consumer Expectations in 2026
Free shipping isn’t a perk anymore. 80% of US online shoppers expect it when their order hits a minimum threshold, and a growing share expects it on every single purchase regardless of cart size.
Consumer Expectation Statistics
- 80% of US consumers expect free shipping when their order meets a certain dollar threshold.
- 66% of shoppers expect free shipping on all orders, regardless of how much they spend.
- 92% of consumers say free shipping offers directly influence their purchase decisions.
- 50.6% of people shop online primarily because of free delivery.
- 79% of consumers say free shipping makes them more likely to shop online in the first place.
- 94% of shoppers rank cost savings, including free shipping, as the top factor when choosing a retailer.
- Nearly half of all US adults now expect free shipping on any order they place, with 16% refusing to buy if they have to pay for delivery.
Two out of three shoppers now expect free shipping on all orders. No minimum. One major study puts that at 66%, and other surveys show similar demand. Nearly half of US adults flat-out expect free shipping on any order. Another 16% won’t buy at all if delivery costs money. That’s not a preference. It’s a hard stop.
So what’s driving this? A Ryder study found 94% of shoppers rank cost savings as their top factor when picking where to shop online. Free shipping sits at the center of that choice. Over a decade of Amazon Prime, Walmart free two-day shipping, and Target same-day has trained buyers to view shipping charges as the seller’s problem. They don’t see free shipping as a bonus. They see paid shipping as a penalty.
Tracking deals across hundreds of stores, we keep seeing the same pattern: free shipping codes get more clicks and uses than even 15-20% off coupons for the same store. Makes sense. A percent discount takes mental math. “Free shipping” is clear right away. No math needed. When we see a store switch from percent-off promos to free shipping offers, the codes get used more almost every time.
💡
Tip: Before adding filler items to hit a free shipping threshold, search for a free shipping promo code first. It often gets you free delivery without spending a dollar more than you planned.
How Shipping Costs Drive Cart Abandonment
Shipping costs are the top reason online shoppers bail on their carts. The Baymard Institute puts the global cart abandonment rate at 70.19% to 70.22%. And 48% of those dropoffs happen due to extra costs like shipping, taxes, and fees.
Cart Abandonment Statistics
- The global average cart abandonment rate sits between 70.19% and 70.22%, meaning roughly 7 in 10 carts never convert to a purchase.
- 48% of shoppers abandon their carts specifically because of extra costs including shipping, taxes, and fees.
- Mobile cart abandonment runs between 80.2% and 85.65%, roughly 15-20 percentage points above desktop rates of 65-72%.
- Gen Z shoppers show the highest abandonment rate at 87%, while Baby Boomers sit at just 55%.
- Cart abandonment costs ecommerce businesses an estimated $4 trillion in lost revenue annually.
- Offering free shipping alone can reduce cart abandonment by approximately 20%.
That 70% number has held steady across years of research and 49 separate studies. The top reason hasn’t budged either. Shipping costs stay at number one. Not even close to second place.
Mobile makes it worse. On phones, the rate climbs as high as 85.65%. Part of this is just browsing, sure. But shipping sticker shock on a small screen plays a big role too. The total jumps at checkout and shoppers bail. On desktop, it’s easier to compare and adjust your cart before that last click.
Worth asking: what does this cost in real dollars? One estimate puts lost revenue from cart drops at $4 trillion per year globally. Not all of that can be won back. Some people are just browsing. But when nearly half bail over added costs, the case for eating shipping costs starts to look very different.
| Generation | Cart Abandonment Rate | Key Shipping Behavior |
|---|---|---|
| Gen Z | 87% | Most price-sensitive, lowest AOV (~$89), browse heavily on mobile |
| Millennials | 78% | Most likely to use Subscribe & Save, expect free 2-day |
| Gen X | 65% | More accepting of standard shipping timelines |
| Baby Boomers | 55% | Lowest abandonment, most likely to shop on desktop |
Free Shipping Adoption Rates Among Retailers
Despite huge demand, free shipping is far from standard. Only 42% of US online orders include free shipping. And the gap varies a lot by store type.
Retailer Adoption Statistics
- Just 42% of US ecommerce transactions include free shipping, despite the fact that most shoppers expect it.
- 71.2% of the Top 1,000 North American retailers offer free shipping in some form.
- Only 20.4% of retailers offer unconditional free shipping on all orders with no minimums.
- 45.1% require a minimum purchase to qualify, while 14.5% tie it to loyalty programs or memberships.
- Jewelry retailers lead adoption at 90.2%, while mass merchants trail at just 57.7%.
- 73.9% of online shoppers cite free shipping as the single most important shipping option available.
- Health and beauty retailers sit at 84.5% adoption, while flowers and gifts come in at 52.4%.
Digital Commerce 360 found that 71.2% of the Top 1,000 North American retailers offer free shipping in some form. But “some form” does a lot of work there. Just 20.4% offer it on all orders, no strings. Another 45.1% need a minimum buy. And 14.5% lock it behind loyalty programs or paid memberships.
Why don’t more retailers just offer it? The short answer is cost. Shipping isn’t cheap, as we’ll see in the next section. For low-margin categories, absorbing $7-10 per order eats into profit fast.
What most guides miss about free shipping adoption is the category logic. A jewelry store selling a $200 necklace can absorb $8 in shipping without blinking. A mass merchant selling a $12 phone charger can’t. The retailers sitting at 57.7% adoption aren’t being stingy. They’re doing margin math on products where the shipping cost sometimes rivals the product price.
Retailer Free Shipping Types
Unconditional20.4%
Min. Purchase45.1%
Loyalty/Membership14.5%
No Free Shipping20.0%
| Retail Category | Free Shipping Adoption Rate |
|---|---|
| Jewelry | 90.2% |
| Health & Beauty | 84.5% |
| Apparel & Accessories | ~75% |
| Mass Merchants | 57.7% |
| Flowers & Gifts | 52.4% |
Average Ecommerce Shipping Costs in 2026
The average ecommerce brand pays $8 to $15 per order to ship packages to customers, and the true cost often runs 25-40% higher once surcharges and returns get factored in.
Shipping Cost Statistics
- The average ecommerce brand spends $8 to $15 per order on shipping, before accounting for surcharges and returns.
- The base-rate average shipping cost is $7.96 per label, while the average fee charged to consumers across top retailers is $7.45.
- Both UPS and FedEx implemented 5.9% general rate increases in 2024, with surcharges continuing to climb.
- Electronics carry the highest average shipping cost at $10.60 per order, while beauty and health products come in lowest at $6.03.
- Each failed delivery attempt costs retailers $17.78 on average.
- Clothing shipping typically runs about 12.73% of the order’s total revenue.
- 84% of ecommerce businesses reported last-mile delivery cost increases over the past year.
On paper, shipping looks manageable. The base-rate average sits at $7.96 per label. A parcelLab study of major US retailers found the average shipping fee charged to consumers is $7.45. But those don’t capture surcharges, weight-based add-ons, home delivery fees, or the cost of handling returns.
Both UPS and FedEx raised rates by 5.9% in 2024, and surcharges kept climbing through 2025. A Progressive Policy Institute report noted that how much carriers compete directly shapes what shoppers end up paying. Less rivalry means higher rates. And the market has shrunk to fewer players.
So where does the money go? Category matters. Electronics cost the most to ship at $10.60 per order. Heavier boxes, more padding needed. Beauty and health products cost the least at $6.03. And when a package never makes it? Each failed drop-off costs the store $17.78. That adds up fast.
| Product Category | Avg. Shipping Cost per Order | Notes |
|---|---|---|
| Electronics | $10.60 | Heavier items, damage protection needed |
| Clothing & Apparel | ~12.73% of revenue | Varies widely by item weight |
| Beauty & Health | $6.03 | Lightweight, compact packaging |
| Average (all categories) | $7.96 | Base rate before surcharges |
Free Shipping Thresholds: The Expectation Gap
The average free shipping threshold is $64, up 23.1% from $52 in 2019. But shoppers say they’ll only spend $43 to qualify. That $21 gap is one of the biggest hidden tensions in online retail.
Threshold Gap Statistics
- The average retailer free shipping threshold is $64, up 23.1% from $52 in 2019.
- Consumers are willing to spend only $43 on average to qualify for free shipping, creating a $21 expectation gap.
- Big box retailers (Amazon, Walmart, Target) have standardized at roughly $35 for non-members.
- Mid-tier retailers (Kohl’s, Macy’s, JCPenney) typically set thresholds around $49 or higher.
- 58% of consumers add extra items to their cart specifically to qualify for free shipping.
- 80% of shoppers say they’re willing to meet a minimum purchase threshold to get free shipping.
- That cart-padding behavior results in a roughly 30% average order value increase for retailers offering free shipping.
$21
The gap between what retailers set as their free shipping threshold ($64 average) and what consumers are actually willing to spend to qualify ($43 average).
Big box stores have settled on $35 for non-members. Amazon, Walmart, and Target all sit near that mark. Mid-tier names like Kohl’s, Macy’s, and JCPenney tend to need $49 or more. That starts pushing against what shoppers will actually spend just for free shipping.
How people fill that gap is telling. 58% of shoppers add extra items to their cart just to qualify. That padding is what drives the 30% bump in order size that stores see with free shipping. People aren’t buying more because they want more. They’re buying more to dodge a fee.
Is a higher bar always bad for shoppers? Not always. If you planned to buy those items anyway, you’re getting free delivery on stuff you needed. The problem starts when the bar pushes you to buy things you don’t want. That’s where the deal turns into a trap.
From testing millions of codes, we’ve noticed something about this gap that most research misses. Shoppers who use free shipping promo codes tend to buy less, but smarter. Instead of padding their cart with filler to hit $64, they apply a code and get exactly what they came for. Looking at how codes get used across major stores, free shipping codes kill the “filler item” problem. Better deal for the shopper, even if the order total is smaller.
| Household Income | Willing to Spend for Free Shipping |
|---|---|
| Under $50,000 | $32 |
| $50,000 – $99,999 | $38 |
| $100,000 – $199,999 | $46 |
| $200,000+ | $53 |
| Retailer Average Threshold | $64 |
How Free Shipping Impacts Conversion Rates and Order Value
Free shipping drives about 20% higher conversion rates across online stores. In controlled tests, the lift can be much bigger. One Australian retailer saw a 36-63% jump during a month-long free shipping promo.
Conversion & AOV Statistics
- Free shipping drives approximately 20% higher conversion rates across ecommerce stores.
- In controlled tests, free shipping promotions boosted conversion rates by 36% to 63%.
- Orders placed with free shipping generate 15-30% higher average order value.
- 37% of retailers reported their average order value increased by more than $7 after offering free shipping.
- 62% of customers say they would increase their purchases from retailers offering free shipping.
- 82% of shoppers are more likely to complete a purchase when free shipping is available.
But does it pay for itself? Usually, yes. Orders with free shipping bring in 15-30% higher order values. In one survey, 37% of stores said their average order rose by more than $7 after adding free shipping. On a $50 order, that’s a 14% boost per sale. More than enough to cover the shipping cost for most items.
The lift is strongest when free shipping shows up as a surprise at checkout. Shoppers who expect to pay and then see it waived feel a boost that’s bigger than the dollar amount saved. Dropping an $8 shipping fee feels larger than an $8 cut off the product price. Same money, bigger impact.
We’ve watched this on our platform. When a store launches a free shipping promo, we see a spike not just in that code’s use but in total traffic to that store’s coupon page. Shoppers on the fence about buying now have a reason to look for more deals. Free shipping acts like a key. It gets people through the door. Then they start hunting for extra ways to save.
Free Shipping vs Fast Shipping: What Consumers Actually Prefer
When forced to pick between free and fast, shoppers pick free. Not even close. A FedEx/Morning Consult study found 75% of shoppers choose free shipping over fast. And 81% will spend more to hit a free shipping threshold rather than pay a delivery fee.
Free vs Fast Shipping Statistics
- 75% of consumers prioritize free shipping over fast shipping.
- 82% would rather wait longer and get free shipping than pay for expedited delivery.
- 81% are willing to increase their order size to meet a free shipping threshold.
- 83% say they’re fine with delayed shipping if it means free delivery.
- 57% of consumers list free shipping as their top priority when placing an online order.
Other surveys show even starker numbers. 82% would rather wait for delivery than pay for expedited shipping. 83% are fine with delays if shipping is free. No contest.
What happens when speed and free collide? The expectation is shifting in a tricky way. 80% of consumers still want same-day delivery as an available option, even if they rarely use it. The sweet spot for most shoppers is free delivery within 3-5 business days, with faster paid options available when they need them. But the willingness to pay for speed is shrinking year over year.
Research backs this up. One study in the Journal of Systems Science found that free shipping offers boost buying intent more for price-sensitive shoppers. That explains why thresholds work so well: they pull in the buyers most likely to convert. Shoppers who care less about price can still pay for speed.
Generational Differences in Free Shipping Expectations
Baby Boomers and Gen Z are on opposite ends here. 30% of Boomers say shipping should always be free. Only 8% of Gen Z agree. That gap, from an Auctane/ShipStation survey, tells a big story.
Generational Shipping Statistics
- 30% of Baby Boomers believe shipping should always be free, compared to just 8% of Gen Z shoppers.
- Gen Z has the highest cart abandonment rate at 87% and the lowest average order value at roughly $89.
- Millennials abandon carts at 78% and are the generation most likely to use Subscribe & Save programs.
- 49% of Millennials expect free two-day delivery on most of their online orders.
- Gen X (65% abandonment) and Boomers (55%) are more accepting of standard shipping timelines.
- Desktop shoppers are more likely to pad orders to meet free shipping thresholds than mobile shoppers, a pattern that skews generational.
Why such a big gap? It comes down to when each group started shopping online. Boomers grew up with catalogs where shipping was baked into the price. They think delivery should be invisible. Gen Z grew up with Amazon Prime, where “free” shipping comes with a membership fee. They know shipping costs money but look for ways around paying for it.
Cart drops tell a different story. Gen Z’s 87% rate doesn’t mean they care more about shipping costs. They browse more on phones and add things they’re not sure about. Boomers at 55% tend to buy what they put in their cart.
49% of Millennials expect free two-day delivery on most orders. They were the first group to grow up with Prime as the norm. Academic research confirms that desktop users pad their orders more than mobile shoppers to hit free shipping marks. Since Boomers shop more on desktop, this pattern tilts by age group.
| Generation | Abandonment Rate | Believe Shipping Should Always Be Free | Speed Expectation |
|---|---|---|---|
| Gen Z | 87% | 8% | Free standard is fine, values flexibility |
| Millennials | 78% | ~15% | 49% expect free 2-day delivery |
| Gen X | 65% | ~22% | Accepts standard 5-7 day shipping |
| Baby Boomers | 55% | 30% | Patience for longer delivery times |
The Amazon Prime Effect on Shipping Expectations
With over 180 million members in the US alone, Amazon Prime has fundamentally reshaped what consumers consider normal shipping. 79% of Prime subscribers cite free shipping as the most important benefit of their membership.
Amazon Prime Statistics
- Amazon Prime has over 180 million members in the United States.
- 79% of Prime subscribers cite free shipping as the most important membership benefit.
- 48% of shoppers say free shipping is their primary reason for shopping on Amazon over other retailers.
- 76% of consumers now expect free two-day shipping when spending $40 or more.
- 61% expect free next-day shipping, and 52% expect free same-day delivery to be available.
- 86% of Prime members feel they get expedited shipping “for free” and don’t mentally account for the membership cost.
The ripple goes way beyond Amazon. 48% of shoppers say free shipping is their main reason for picking Amazon. That beats ease of use (44%) and quick delivery (36%). When close to half the country has a membership with free shipping built in, it changes what every other store has to offer.
But can other stores keep up? Here’s the issue. 86% of Prime members feel like their fast shipping is “free.” They don’t think about the yearly fee. Free shipping is just how things work, in their minds. So when they visit another store and see a $7.45 charge, it feels like a penalty. Not a fair price for a service.
And it keeps going. 76% expect free two-day shipping on orders of $40 or more. 61% expect free next-day. The bar moves every year, and every year stores ask the same thing: can we afford this?
Last-Mile Delivery Costs and Global Parcel Market Growth
Last-mile delivery, the final leg from a distribution center to the customer’s doorstep, now accounts for 53% of total shipping costs. That’s up from 41% in 2018, and the trend keeps accelerating.
Last-Mile Delivery Statistics
- Last-mile delivery accounts for 53% of total shipping costs, up from 41% in 2018.
- The last-mile delivery market is valued at $199.68 billion in 2026.
- The global parcel delivery market is projected to reach $538 billion in 2026.
- An estimated 236 billion parcels will be delivered globally in 2026.
- 84% of ecommerce businesses reported last-mile delivery cost increases in the past year.
- Same-day delivery has grown into a $17.8 billion market, expanding at 20.8% annually.
- Labor accounts for 50-60% of last-mile delivery costs, making this segment especially vulnerable to wage inflation.
The numbers are huge. The last-mile segment is worth $199.68 billion in 2026. The wider ecommerce logistics market hits $624.33 billion. And the fulfillment services slice alone is $141.35 billion.
84% of online stores saw last-mile costs go up in the past year. Labor makes up 50-60% of those costs, so wage hikes and driver shortages hit hard. The global parcel market expects to move about 236 billion packages in 2026, a $538 billion industry.
Same-day delivery is still small but growing fast: $17.8 billion, up 20.8% per year. That adds pressure. Shoppers want free shipping but the cost of getting boxes to their door keeps going up. Something has to give. Stores eat more cost, buyers pay more in product prices, or the whole delivery model has to change.
Returns, Reverse Logistics, and Free Return Shipping
Returns are the hidden cost threatening to break the free shipping equation. US retail returns reached nearly $850 billion in 2025, with online return rates running at 19.3%, roughly one in five packages shipped back.
Returns & Reverse Logistics Statistics
- US retail returns totaled $890 billion in 2024 (16.9% of sales) and a projected $849.9 billion in 2025 (15.8%).
- Online return rates sit at 19.3% in 2025, projected to reach 20-24.5% in 2026.
- 82% of consumers say free returns are an important factor in their online purchase decisions.
- 65.2% of merchants now charge fees for mail-in returns, with the average fee at $9.04.
- Each return costs retailers between $10 and $65 depending on product type and processing.
- 67% of consumers say a negative return experience discourages them from shopping with that retailer again.
82% of shoppers say free returns matter when they pick where to buy. That puts stores in a bind: offer free returns and lose money, or charge for them and lose buyers.
So who’s winning? More and more, the stores who charge. 65.2% of sellers now tack on a fee for mail-in returns, $9.04 on average. Big shift from a few years ago, when free returns were seen as must-haves. But 67% of shoppers say a bad return deal stops them from buying again. The stakes cut both ways.
A Copenhagen Business School study dug into this over three years with one retailer. Free shipping promos lifted sales but also lifted returns. Whether it nets out as profit depends on what you sell and what your costs look like.
Looking at our platform data, we’ve seen more stores split their free shipping and free returns into two separate deals. A store might ship free on orders over $50 but charge $7.99 for returns. Shoppers often miss this until after they’ve paid. When we see return shipping codes pop up for a store, it’s a sign they just started charging and want to see how buyers react.
⚠️
Attention: The FTC’s Trade Regulation Rule on unfair fees now covers hidden shipping charges in ecommerce. Retailers who bury shipping or return costs until checkout may face regulatory scrutiny.
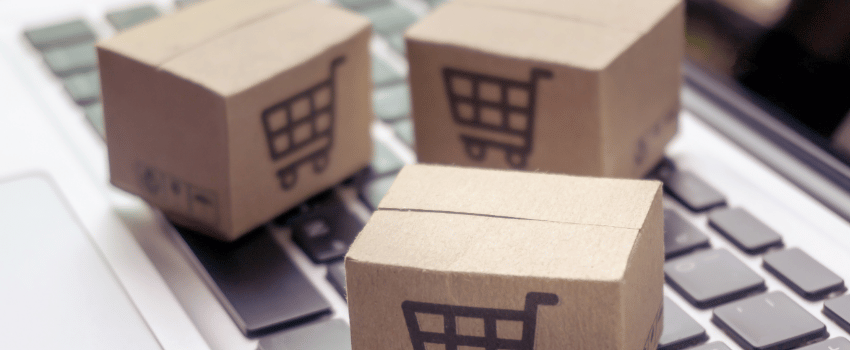
How Shoppers Can Save on Shipping Costs
The data paints a clear picture: shipping costs keep rising and retailers aren’t rushing to absorb them all. But concrete strategies exist that actually work. What’s the smartest approach?
Savings Tips
- Free shipping promo codes save shoppers $8 to $15 per order on average, the typical cost retailers charge for delivery.
- 58% of shoppers pad their carts with extra items to qualify for free shipping, but a promo code eliminates that need.
- Membership programs like Amazon Prime, Walmart+, and Target Circle 360 include free shipping and can pay for themselves within a few orders.
- Holiday seasons and events like National Free Shipping Day (December) see the highest concentration of free shipping offers.
- Buy-online-pickup-in-store (BOPIS) eliminates shipping costs entirely, and most major retailers process pickup orders within hours.
Use free shipping promo codes and coupons. Before padding your cart with filler items to hit a threshold, check for a free shipping code. DontPayFull tracks free shipping codes across thousands of stores, and applying one takes seconds. It’s often the simplest path to free delivery without spending more than you planned.
Meet thresholds strategically. If you can’t find a code, the $64 average threshold doesn’t have to mean wasted money. Add items you actually need. Restocking household basics or buying a birthday gift early is smart threshold shopping. Buying things you’ll never use just to save $8 on shipping isn’t.
Join loyalty programs that include free shipping. Amazon Prime, Walmart+, and Target Circle 360 all bundle free shipping into their membership benefits. If you shop frequently at one retailer, the annual cost often pays for itself in shipping savings within a few orders.
Time your purchases around free shipping promotions. Retailers run more free shipping deals during holiday seasons and around events like National Free Shipping Day in December. Planning larger purchases for these windows saves real money over the course of a year.
Choose in-store or curbside pickup. This one eliminates shipping entirely. Most major retailers offer BOPIS with orders ready within hours. If you live near the store, it’s the fastest and cheapest option.
The trick that actually works for most shoppers is combining strategies. A free shipping code stacked with a percentage-off coupon on a purchase you were already planning hits the savings trifecta: no shipping cost, a lower product price, and no filler items inflating your total. Tools like our Chrome extension can test available codes automatically at checkout, which saves the manual search.
Methodology
The stats in this article come from public data published between 2024 and 2026. Main sources include the Baymard Institute (cart data), the National Retail Federation (returns), Digital Commerce 360 (retailer surveys), Statista (shopper behavior), the FedEx/Morning Consult shipping survey, parcelLab’s US Shipping Study 2025, GoBolt’s cost analysis, and Opensend’s shipping benchmarks.
Academic sources include studies from Copenhagen Business School (shipping and returns), a Journal of Systems Science paper on free shipping coupons, and SSRN research on how shoppers pad orders. The Federal Trade Commission‘s rule on unfair fees adds context. Market size data comes from Research and Markets, Fortune Business Insights, and Precedence Research.
When sources gave different numbers for the same thing, we used the newest one. DontPayFull platform notes are based on coupon usage patterns, not formal surveys.
The Bottom Line
Free shipping has shifted from a competitive advantage to a baseline consumer expectation. With 66% of shoppers demanding it on every order and 48% abandoning carts over shipping costs, the retailers who don’t offer it are leaving significant revenue on the table. For shoppers, the smartest move is to use free shipping promo codes before padding your cart with filler items to meet a $64 threshold. The data is clear: free shipping isn’t optional anymore, for retailers or for the shoppers looking to save.
FAQ
What percentage of consumers expect free shipping?
Between 66% and 80% of consumers expect free shipping on their online orders. 80% expect it when a minimum purchase threshold is met, while 66% expect it on all orders regardless of size. Nearly half of US adults (45%) expect free shipping on every single purchase they make.
Does free shipping increase online sales?
Yes. Free shipping drives roughly 20% higher conversion rates and can boost average order value by 15-30%. In a controlled test, one retailer saw conversion jump 36-63% during a free shipping promotion. 37% of retailers report that AOV increased by more than $7 after adding free shipping.
What is the average free shipping threshold in 2026?
The average retailer free shipping threshold is $64, up 23.1% from $52 in 2019. Big box retailers like Amazon, Walmart, and Target set their non-member thresholds around $35, while mid-tier retailers like Kohl’s and Macy’s typically require $49 or more.
Do consumers prefer free shipping or fast shipping?
Free shipping wins decisively. 75% of consumers prioritize free shipping over fast shipping, and 82% would rather wait longer than pay for expedited delivery. 81% are willing to spend more to qualify for free shipping rather than pay a delivery fee.
How much does shipping cost affect cart abandonment?
Shipping costs are the single biggest driver of cart abandonment. 48% of all cart abandonments happen because of extra costs including shipping, taxes, and fees. This outpaces account creation requirements, slow delivery estimates, and every other friction point at checkout.
Which generation cares most about free shipping?
Baby Boomers care the most about free shipping being unconditional: 30% believe shipping should always be free, compared to just 8% of Gen Z. Gen Z has the highest cart abandonment rate (87%) overall, but that’s driven by casual mobile browsing habits rather than shipping sensitivity alone.
What percentage of retailers offer free shipping?
71.2% of the Top 1,000 North American retailers offer free shipping in some form. But only 20.4% offer it on all orders with no conditions. 45.1% require a minimum purchase, and 14.5% restrict it to loyalty program members or other qualifying criteria.
How does free shipping affect average order value?
Free shipping increases average order value by 15-30%. The mechanism is straightforward: 58% of consumers add extra items to their cart specifically to reach the free shipping threshold. 37% of retailers saw their AOV jump by more than $7 after introducing free shipping offers.
Data compiled by the DontPayFull Research Team based on publicly available data from government agencies, academic institutions, and industry research firms.
Sources
- Radial/Dynata via Red Stag Fulfillment: Consumer free shipping expectations survey (2025)
- eMarketer/Radial/Dynata: US adult shipping expectations data (2025)
- Ryder E-commerce Study: Consumer cost savings priorities (2025)
- Baymard Institute: Cart abandonment rate research compilation (2025-2026)
- SellersCommerce: Free shipping statistics and retailer data (2025)
- Digital Commerce 360: Free shipping adoption by retail category (2024)
- GoBolt: Ecommerce shipping cost analysis (2026)
- Opensend: Shipping cost benchmarks by product category (2025)
- parcelLab US eCommerce Shipping Study: Average shipping fees across top US retailers (2025)
- Red Stag Fulfillment: Free shipping threshold analysis and trends (2024-2025)
- ClickPost: Consumer shipping behavior data (2025)
- Devote Digital: Free shipping conversion rate case study (2025)
- FedEx/Morning Consult via IndustryIntel: Consumer shipping preference survey (2024)
- Statista: Amazon Prime membership and benefits data (2025)
- Research and Markets: Last-mile delivery market report (2026)
- Fortune Business Insights: Global ecommerce logistics market projection (2026)
- Precedence Research: E-commerce fulfillment services market valuation (2025)
- NRF via NJBIA: Consumer return merchandise data (2025)
- Copenhagen Business School: Free shipping promotions and product returns academic study (2025)
- Progressive Policy Institute: Parcel shipping and ecommerce competition report (2025)
- Federal Trade Commission: Trade Regulation Rule on unfair fees (2024)
- Journal of Systems Science/Springer: Free shipping coupon effects on purchase motivation (2025)
- SSRN Academic Research: Cross-channel free shipping threshold behavior study (2023)
Do You Have Any Suggestions?
We're always looking for ways to enrich our content on DontPayFull.com. If you have a valuable resource or other suggestion that could enhance our existing content, we would love to hear from you.
Was this content helpful to you?
Related Articles