No votes yet.

Loyalty Program Statistics 2026: Membership Trends, Engagement Data, and ROI Insights
The latest loyalty program statistics for 2026, covering a $27 billion US market, 5.2x ROI, and $10 billion in unclaimed consumer rewards. Learn what the data says about membership trends, engagement gaps, and how to actually maximize your loyalty program value.
US consumers are sitting on an estimated $10 billion in unspent loyalty rewards every year. That’s not a rounding error or a niche complaint. It’s the single biggest story hiding inside the loyalty program data for 2026. Brands have built a $27 billion industry on the premise that rewards drive behavior. They do. But a lot of those rewards never get used, and that gap between what consumers earn and what they actually redeem is where the real story lives.
This roundup pulls together the freshest loyalty program statistics across market size, ROI, spending behavior, and more. Whether you’re a shopper trying to figure out if loyalty programs are worth your time or you just want to know how they work, here’s what the numbers say.
Key Takeaways
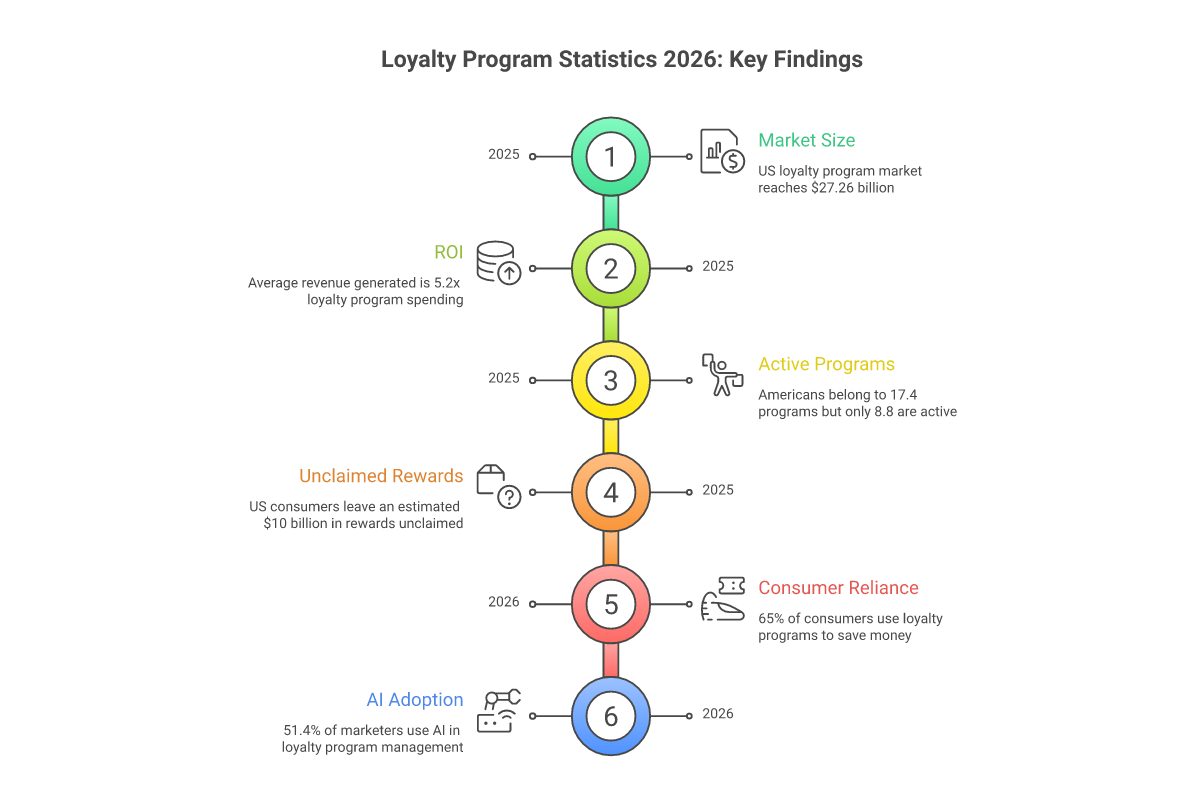
- ✓ The US loyalty program market hit $27.26 billion in 2025 and is growing at 15.7% annually, but consumer satisfaction sits at only 48%.
- ✓ Loyalty programs generate 5.2x more revenue than they cost businesses, yet consumers leave an estimated $10 billion in unspent rewards unclaimed every year.
- ✓ The average American belongs to 17.4 loyalty programs but actively uses fewer than half, with only 8.8 considered active memberships.
- ✓ Members who actually redeem rewards spend 3.1x more annually than members who never redeem. Engagement is the whole game.
- ✓ AI adoption in loyalty is accelerating fast: 51.4% of marketers now use it, and AI-powered programs see 39.6% higher enrollment rates.
Key Loyalty Program Statistics at a Glance
$27.26B
US market size (2025)
5.2x
Revenue vs. program cost
$10B
Unspent US rewards/yr
17.4
Avg memberships per person
A few things jump out from these numbers. The business case is clear: programs generate 5.2x more revenue than they cost, per Antavo’s 2025 data. But the consumer side is messier. People join more programs than they can realistically use, and rewards pile up unclaimed.
65% of consumers said they rely on loyalty programs to save money during tough times, per a commercetools survey. That’s a high number. It means most people aren’t joining for the novelty. They’re joining because they need to stretch their budget. That makes the $10 billion in unclaimed rewards even more striking.
So what does this mean for you as a shopper? The programs deliver value, but only if you use them. That theme runs through almost every data point in this roundup.
Loyalty Program Market Size and Growth
The loyalty industry is massive and expanding fast. The global loyalty management market was valued at $10.67 billion in 2023 and is projected to reach $28.65 billion by 2030, per Fortune Business Insights data.
In the US specifically, Research and Markets projects the domestic market at $27.26 billion in 2025, climbing to $44.73 billion by 2029 at a 13.2% compound annual growth rate. Mordor Intelligence runs slightly different projections: $16.44 billion in 2026 reaching $32.52 billion by 2031 at a 14.62% CAGR. The exact figures vary by methodology, but the direction is consistent. This industry is growing fast.
Loyalty Management Market Growth
Global and US market size milestones across research firms
Global market (2023 actual)$10.67B
US market (2025 projected)$27.26B
Global market (2030 projected)$28.65B
Market trajectory: nearly 3x global growth from 2023 to 2030
Why is the market growing so fast? Acquiring new customers has gotten brutal. The cost has climbed nearly 60% over the past five years, with businesses losing an estimated $29 per new customer acquired. Retention looks cheap by comparison. Keep someone you’ve already paid to bring in, and the loyalty program pays for itself quickly, especially since members spend 12-18% more than non-members annually.
90% of companies now have some form of loyalty program. That’s near-ubiquitous adoption. It also means the market is competitive, and programs that don’t differentiate tend to get ignored.
Membership and Enrollment Statistics
The average American belongs to 17.4 loyalty programs but is only active in 8.8 of them, per Bond Brand Loyalty’s 2025 report. That gap between joining and actually using is one of the defining challenges in the industry right now. Deloitte research puts the numbers a bit lower, estimating consumers enroll in roughly 8 programs but actively use only about 5.
Either way, fewer than half of enrolled members are actually engaged. The average annual activity rate across programs is 59% (Antavo). So even counting programs where someone made at least one transaction, the rest of the time a member is sitting dormant.
Loyalty Program Enrollment vs. Active Use
Active programs8.8 of 17.4 (51%)
Inactive (enrolled only)8.6 of 17.4 (49%)
From tracking coupon behavior across hundreds of stores, one pattern keeps showing up. Shoppers who join a loyalty program right at the moment of purchase rarely come back to manage it. They collect the signup bonus, never download the app, and then wonder a year later why they have 200 points expiring. The programs that keep members engaged set up a reminder loop, usually via email or app notification, within the first 30 days. If you join a program and never get a “here’s what you’ve earned” email within a week, it’s a sign the program wasn’t designed to actually help you redeem.
What most guides miss is that the membership-to-engagement gap is really a user experience failure, not a preference failure. Consumers aren’t choosing to leave money on the table. They’re just not given enough nudges to realize they have money on the table.
Loyalty Program ROI and Revenue Impact
For businesses, the math on loyalty programs is straightforward: they work.
Programs generated 5.2x more revenue than their costs in 2025, up from 4.8x the year before, per Antavo’s Global Customer Loyalty Report. And 83% of program owners who measured ROI reported positive returns. Top-performing programs boost revenue by 15-25% annually, per McKinsey data.
5.2x
Revenue vs. cost ratio
83%
Owners report positive ROI
3.1x
Spend: redeemers vs. non
1.8x
Tiered vs. flat ROI
The most striking ROI stat isn’t at the program level. It’s at the member level. Members who redeem rewards have annual spend that’s 3.1x higher than members who don’t redeem. Redemption drives behavior. When a member cashes in points and sees a discount applied, they tend to spend more on the next visit. The psychology is real, and the data confirms it.
Tiered programs show 1.8x higher ROI than non-tiered programs. Tiers create aspiration. Moving from Silver to Gold isn’t just about extra benefits. It’s about status and the sense of progress. Programs that tap into that psychology tend to outperform flat-rate point systems by a wide margin.
Loyalty program owners now allocate 31% of their total marketing budget to loyalty and CRM. And 9 out of 10 companies with existing programs plan to revamp within three years, which suggests most businesses know their current setup isn’t performing as well as it could.
Consumer Spending and Savings Behavior
Loyalty members spend 12-18% more than non-members annually. That’s the headline, but the story inside that number is more interesting. The spending boost concentrates heavily among members who actually interact with the program, not passive cardholders.
66% of consumers say earning rewards changes their spending behavior. And 73% modify their spending to maximize loyalty benefits, per Bond Brand Loyalty data. People route purchases through certain channels, top up a cart to hit a points threshold, or wait for double-points events. The programs are successfully steering behavior.
The personalization angle is where the gap between average and excellent programs really shows. Consumers who redeem personalized rewards spend 4.3x more than those redeeming generic rewards, per Antavo. That’s not a marginal improvement from customization. It’s a category difference.
💡
Tip: If a loyalty program lets you set preferences for the types of deals you receive, use it. The gap between generic and personalized rewards isn’t small.
Perceived monthly savings from loyalty programs hover around $56 per consumer. Whether that’s actual cash back or perceived value from rewards, it’s meaningful for budget-conscious shoppers.
The trick that actually works for maximizing loyalty value isn’t collecting points across a dozen programs. It’s going deep on two or three programs where you already spend consistently. Spreading across 17+ programs means you’re constantly below redemption thresholds. Focusing on 3-5 programs means your points accumulate fast enough to use. And stacking is real: when you can combine a loyalty discount with a promo code at checkout, the savings add up quickly. Our Chrome extension can automatically apply coupon codes at checkout, which is especially useful when you’re also redeeming loyalty points and want to capture both discounts.
The $10 Billion Problem: Unclaimed Loyalty Rewards
This is the stat that doesn’t get enough attention. US consumers miss out on an estimated $10 billion in unspent loyalty points annually, per Antavo’s 2026 report. More than a quarter of loyalty points earned by US shoppers go completely unspent. That’s not a few people being forgetful. It’s a structural problem.
$10B
estimated in loyalty rewards left unclaimed by US consumers every year, per Antavo’s 2026 Global Customer Loyalty Report.
The average redemption rate across loyalty programs sits at roughly 50%, meaning half of all rewards earned never get used. The most common consumer complaint about loyalty programs is that they take too long to deliver meaningful rewards. 56% of shoppers changed or abandoned a purchase after their points expired, per Code Broker. That’s a lose-lose. The consumer loses rewards they earned, and the business loses a purchase.
What’s actually going on is a design issue more than a consumer attention issue. Programs that require large point totals before any redemption tend to have much higher breakage rates. Breakage is the term for unspent rewards, and some programs budget for it because they know a slice of points will never be used. From tracking deals and promotions across thousands of stores, we’ve noticed that programs with lower redemption thresholds and more frequent small rewards keep members more engaged. Even when the total annual value is similar, frequent small wins beat a single big reward you have to wait months for. The psychology of “you earned it, here it is” beats “keep going, you’re almost there.”
⚠️
Attention: Loyalty points often expire after 12-24 months of inactivity. Even a small redemption resets the clock at many programs.
The practical move for consumers: check your loyalty balances at least once a month. Watch for expiration dates. Programs don’t always send clear warnings. If points are about to expire, use them on something you’d buy anyway, even a smaller item, rather than lose them entirely.
What Drives and Breaks Customer Loyalty
77% of consumers say they retract their loyalty more quickly now than three years ago. Big shift. Loyalty isn’t as sticky as it used to be.
The top drivers of loyalty are somewhat predictable: product quality cited by 48%, good value at 53%, and personalized experiences at 80%. But the loyalty breakers are worth watching more closely because they’re actionable.
54% of consumers say lower product quality weakens their loyalty, per SAP Engagement Cloud. Price increases damage loyalty for 49%. And 47% cite poor customer service as a loyalty breaker. One bad interaction is enough for 1 in 3 customers to walk away entirely.
What Builds Loyalty
- + Good value for price (53%)
- + Personalized experiences (80%)
- + Consistent product quality (48%)
- + Efficient digital experience (77% of millennials)
What Breaks Loyalty
- − Quality decline (54%)
- − Price increases (49%)
- − Poor customer service (47%)
- − One bad experience (1 in 3 shoppers)
True Loyalty, defined as deep brand devotion regardless of price, declined 5% from 2024 to just 29% in 2025. That said, 68% of consumers still report being loyal to certain brands. The middle ground is conditional loyalty: shoppers who prefer a brand when the price is right but won’t pay a premium to stay. Loyalty programs built around spend-and-earn don’t tend to change that dynamic.
Generational Loyalty: Gen Z vs. Millennials vs. Boomers
The generational breakdown of loyalty behavior is one of the most useful data cuts in this research. Different generations don’t just prefer different rewards. They think about brand loyalty in very different ways.
Gen Z shows a 60% likelihood to join a loyalty program, compared to a 43% global average. So they’re joining at higher rates than older generations. But Gen Z loyalty is experience-driven, not discount-driven. They prefer experiences and brand values over simple cash back. 39% of Gen Z shoppers have switched brands over sustainability. And 15% buy products purely because they’re trending on social platforms, which is a type of loyalty that has nothing to do with points programs.
Millennials are 77.3% deal-driven and care a lot about getting offers that match their habits. 42% of millennials show loyalty by installing a brand’s app, which is a concrete signal of real interest.
Boomers lean transactional. 80.5% are primarily savings-motivated in their loyalty choices, and they prefer simple structures over complicated tier systems. 65% show loyalty through purchase frequency rather than brand advocacy.
| Generation | Primary Motivation | Key Behavior | Top Priority |
|---|---|---|---|
| Gen Z | Experience, sustainability | Higher join rate (60%) | Exclusive access, brand values |
| Millennials | Personalization, deals | App installs (42%) | Seamless digital UX |
| Boomers | Savings, simplicity | Purchase frequency (65%) | Clear value, easy redemption |
All three generations agree on one thing: efficient digital experiences matter. 77% of millennials and 75% of Gen Z cite it as a top priority for loyalty programs. Even Boomers rank it at 45%. A clunky app or confusing points system is a loyalty killer across all age groups.
AI and Personalization in Loyalty Programs
51.4% of marketers now use AI in their loyalty program management, up from 37.1% the year prior. That’s a significant jump in adoption, and it’s showing measurable results. AI-powered programs see 39.6% higher enrollment rates and 37% more member spending.
The churn improvement is notable too. AI reduces churn by an estimated 30% through dynamic, real-time offer tailoring. When a loyalty program knows you haven’t shopped in 45 days and sends a targeted 20% off your most-purchased category right at your typical shopping window, that’s different from a generic “we miss you” email.
92% of companies are already using AI-driven personalization to drive growth, per Segment. But consumers aren’t fully comfortable with this. Only 41% feel comfortable with companies using AI for personalization, and 68% say AI advancements make trustworthiness more important in brand relationships, per Salesforce. The tech works, but shoppers want to know what their data is used for.
The AI adoption curve is still in the early-majority phase. Companies that use AI well while being open about data use will likely pull ahead on loyalty over the next few years.
Paid and Premium Loyalty Programs
Paid loyalty models are growing 3x faster than traditional points systems. Part of that is demand for guaranteed value rather than earning toward a distant reward. 22% of businesses now offer premium or paid loyalty programs, and 64% of consumers say they’d be willing to pay for exclusive loyalty perks.
The behavioral difference between free and paid members is significant. Paid members are 62% more likely to increase spending at that brand after joining. The psychology: if you’ve paid for membership, you have an incentive to use it enough to justify the cost. That changes shopping behavior.
Amazon Prime members spend more than double what non-member customers spend at Amazon. Starbucks Rewards accounts for 53% of all spend in US Starbucks stores. These aren’t outlier programs. They’re the benchmarks the rest of the industry points to.
88% of satisfied paid members prefer that brand over cheaper rivals, per KPMG data. That’s the real win. You’re not just getting repeat purchases. You’re building a preference that holds even when a cheaper option shows up.
The consumer question is simple: does the math work for your habits? A paid membership makes sense if you buy from that retailer often and the savings exceed the annual fee. For less frequent shoppers, paid loyalty is usually a worse deal than staying with a free program and being selective about when you redeem.
Loyalty Program Success Stories by the Numbers
Real-world program performance shows what’s actually possible when programs are run well.
Starbucks Rewards accounts for 53% of all US Starbucks store spend. More than half of their entire US revenue runs through loyalty members. Sephora’s Beauty Insider members account for 80% of total Sephora sales. Adidas adiClub members buy 50% more often and have double the lifetime value of non-members. Those aren’t programs that offer a coupon here and there. They’re deeply integrated into the shopping experience.
H&M’s loyalty program grew 71% year-over-year and now has 120 million members globally. Lululemon signed up 9 million members in just five months after launching its revamped paid program. And American Airlines AAdvantage is valued at over $20 billion as an asset, more than the planes.
The common thread isn’t the type of reward. It’s that members are built into the shopping routine. Starbucks members order through the app. Sephora members get personal picks sent to them. The programs became part of how these customers shop by default, not an occasional bonus they remember to use.
How to Maximize Your Loyalty Program Savings
Here’s something you won’t find covered in most statistics roundups: the consumer-side strategy for getting actual value from these programs.
Audit your programs first. Log into every loyalty account you have and check your current balances. If you haven’t done this in more than six months, you may have rewards close to expiring without knowing it.
Pick three, go deep. Choose the programs that align with where you already spend money. If you buy groceries at the same chain weekly, drink coffee regularly, and order online frequently, those three programs deserve your focus. Everything else is optional.
Track expiration dates. Most programs will email you when points are about to expire, but don’t count on it. Note expiration dates somewhere you’ll actually see them.
Stack when you can. Loyalty programs and coupon codes often work together. When you find a promo code for a store where you’re also a loyalty member, apply both. DontPayFull tracks coupon codes across thousands of stores, so you can quickly check whether there’s a stackable code before you checkout. Tracking deals across hundreds of stores, one pattern keeps showing up with loyalty stacking: most shoppers who could combine a loyalty discount with a promo code don’t do it because they don’t check for the coupon code. They apply their loyalty at checkout and hit “place order” without a second thought. The stores aren’t going to tell you to look for more discounts. That’s the check you have to do yourself.
Run the math on paid tiers. Calculate the actual value you’d get based on your real spending patterns. Don’t assume premium loyalty programs are automatically worth the fee. Run the numbers for your specific usage.
Methodology and Sources
The statistics in this article come from published research reports and industry surveys, mostly covering 2024-2026 data. Key sources include the Antavo Global Customer Loyalty Report, Bond Brand Loyalty’s 2025 report, Deloitte consumer research, SAP Engagement Cloud data from Emarsys, Salesforce, commercetools surveys, and Queue-it’s loyalty program roundup.
Market size numbers come from Fortune Business Insights, Research and Markets, and Mordor Intelligence. Figures vary by firm based on how they define “loyalty management.” We’ve noted the source for each projection.
Stats are shown as reported. Where sources differ slightly, we used the most recent data and noted the source. Our team reviews and updates this article as new reports come out.
The Bottom Line
Loyalty programs deliver real value on both sides of the transaction, but the consumer benefits are front-loaded toward members who actually engage. The 5.2x ROI that brands see comes largely from the members who redeem, who spend 3.1x more than non-redeemers. As a shopper, the math is simple: join fewer programs, use them actively, and stack a coupon code on top of your loyalty discount whenever you can. The $10 billion sitting unclaimed in US loyalty accounts is money consumers already earned and simply didn’t collect. Don’t leave yours on the table.
Frequently Asked Questions
How effective are loyalty programs for businesses?
Loyalty programs are highly effective when measured against cost: they generate 5.2x more revenue than they cost on average, per Antavo’s 2025 data, and 83% of program owners who measured ROI report positive returns. Top-performing programs boost annual revenue by 15-25%. The key driver is member engagement. Members who actually redeem spend 3.1x more than those who just have a card but never use it.
How many loyalty programs does the average person belong to?
The average American belongs to 17.4 loyalty programs but is only active in about 8.8 of them, per Bond Brand Loyalty’s 2025 report. Deloitte research shows enrollment of roughly 8 programs with active use in about 5. The gap between enrollment and engagement is one of the biggest structural issues in the industry.
What is the average ROI of a loyalty program?
The average ROI across programs is 5.2x the investment, up from 4.8x the year prior. Tiered programs outperform flat programs at roughly 1.8x the ROI. Top performers (per McKinsey data) report 15-25% annual revenue boosts, while poorly structured programs can show near-zero returns.
Do loyalty programs actually save consumers money?
Yes, but only for active users. Perceived monthly savings hover around $56 per consumer across programs. 65% of consumers say they rely on loyalty programs to manage their budget. The catch is that consumers leave an estimated $10 billion in unspent rewards unclaimed annually, meaning many people are earning value they never actually collect.
What percentage of loyalty program points go unused?
More than a quarter of US loyalty program points go unspent, adding up to an estimated $10 billion in unclaimed savings annually. The average redemption rate across programs is roughly 50%. Programs with high accumulation thresholds before first redemption tend to have higher breakage rates.
Are paid loyalty programs worth the cost?
For frequent shoppers at a given retailer, yes. Paid members are 62% more likely to increase their spending at that brand, and 88% of satisfied paid members prefer that brand over cheaper competitors per KPMG. Amazon Prime is the clearest case: members spend more than double non-members. But the math only works if you shop there often enough that the membership cost is offset by the benefits you actually use.
Sources
- Antavo Global Customer Loyalty Report: Comprehensive loyalty statistics including ROI, redemption rates, generational data, and program benchmarks (2024-2026)
- BusinessWire / Antavo 2026 press release: $10 billion in unspent US loyalty rewards annually (2026)
- Queue-it loyalty program statistics roundup: Enrollment, membership, spending behavior, and program success stories (2025)
- SAP Engagement Cloud / Emarsys customer loyalty statistics: True Loyalty decline, loyalty drivers and breakers, acquisition cost data (2025)
- commercetools consumer survey: 65% of consumers reliant on loyalty programs during economic pressure (2025)
- Bond Brand Loyalty / The Wise Marketer: Average membership numbers, satisfaction rates, generational behavior (2025)
- Deloitte / LinkedIn research: Consumer enrollment and active use benchmarks, digital experience priorities (2025)
- Netguru AI loyalty analysis: AI-powered program enrollment and spending lift data (2026)
- Shno.co marketing statistics: AI adoption rates in loyalty management, paid loyalty growth rates (2026)
- Antavo Gen Z loyalty statistics: Gen Z loyalty behavior, join rates, sustainability preferences (2026)
- Research and Markets via Webull: US loyalty market size and growth projections (2025)
Do You Have Any Suggestions?
We're always looking for ways to enrich our content on DontPayFull.com. If you have a valuable resource or other suggestion that could enhance our existing content, we would love to hear from you.
Was this content helpful to you?
Related Articles