No votes yet.

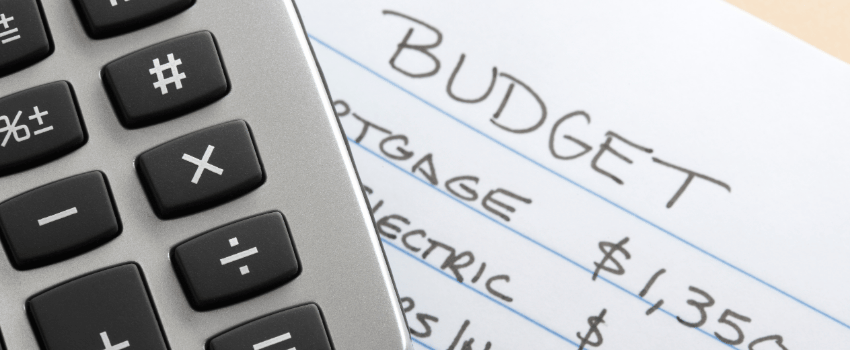
Holiday Shopping Statistics: 75+ Key Facts, Trends & Insights
The 2025 US holiday season crossed $1 trillion for the first time in history. This guide compiles 75+ sourced holiday shopping statistics from government agencies and major industry reports, covering Black Friday, Cyber Monday, BNPL, AI adoption, returns, and per-person spending data.
The 2025 US holiday season crossed the trillion-dollar mark for the first time in history. Not approaching it. Not projected to hit it someday. Past it, confirmed, with more than $1 trillion in US retail sales spanning November and December.
For anyone tracking consumer spending, that number lands differently than the usual “record season” headline. A trillion dollars means roughly $3,000 per US resident bought, wrapped, and shipped in two months. And behind that milestone is a complicated story. Income divergence. A mobile tipping point. $181 billion in returns. And a 693% surge in AI-driven retail traffic that still didn’t convince most shoppers to use ChatGPT for gift ideas.
The DontPayFull research team compiled this guide from government agency data, major industry reports, and academic surveys to give you the most complete picture of holiday shopping available in one place. Every stat is sourced. Trends are explained. And where the numbers have a direct savings angle, we’ve flagged it.
Key Takeaways
- ✓ US holiday retail sales topped $1 trillion for the first time ever in the 2025 season, a historic milestone confirming consumer spending resilience.
- ✓ Mobile devices crossed the 50% threshold for online holiday transactions in 2025, with smartphones accounting for 56.4% of all online purchases.
- ✓ AI traffic to retail sites surged 693.4% year-over-year, yet 85% of Americans still didn’t use AI tools to help them shop in 2025.
- ✓ More than $181 billion in global holiday purchases were returned after the season, representing 14% of all purchases made between November 1 and December 31.
- ✓ Electronics offered the deepest discounts of the season at 30.9% off listed price; toys hit 29.6% off and apparel reached 25.1% off at their respective peaks.
Holiday Shopping Overview: The Big Numbers
US holiday retail sales cleared $1 trillion in the 2025 season, and online spend alone hit $257.8 billion, the first quarter-trillion online holiday season on record.
Key Statistics
- US holiday retail sales surpassed $1 trillion for the first time in 2025, up about 4.1% year-over-year, confirming a historic milestone for the US retail sector.
- Online holiday spend reached $257.8 billion in 2025 (November 1-December 31), up 6.8% year-over-year, making it the first quarter-trillion online holiday season in history.
- Salesforce measured $1.29 trillion in global online holiday sales and $294 billion in US online sales, reflecting broader November-January tracking windows.
- 92% of US adults, representing about 246 million people, participated in holiday spending during the 2025 season, averaging $1,081 per person on holiday-related goods and services.
- Consumer spending rose 6.4% year-over-year across the 2025 holiday season, with growth of 6-8% in food, apparel, electronics, and beauty categories.
- Electronic shopping and mail-order houses generated $92.6 billion in retail sales in December 2024 alone, the highest total for any month that year.
- Q4 2025 total retail sales reached $1,900.5 billion (seasonally adjusted), up 2.7% from Q4 2024, per US Census Bureau quarterly data.
The trillion-dollar threshold got crossed for several reasons. Persistent consumer spending despite tariff anxiety. A longer effective shopping season. And a high-income cohort that drove most of the growth. PwC’s post-holiday analysis puts the year-over-year increase at 6.4%, with growth spread across food, apparel, electronics, and beauty.
But the headline hides a split story. Middle- and lower-income shoppers cut back. They bought less and traded down. High earners spent freely. So the “record season” didn’t feel like a record to everyone in it.
Salesforce tracked $1.29 trillion in global online holiday sales and $294 billion in US online sales, numbers that differ from Adobe’s $257.8 billion because Salesforce uses a broader November 1-January 31 window. Both figures are correct; they’re just measuring different things. That said, both point the same direction: holiday online spend grew solidly.
US Online Holiday Spend Growth (Nov 1-Dec 31)
Source: Adobe Analytics, 2022-2025
2025$257.8B
2024$241.4B
2023$222.1B
2022$204.5B
2025 growth vs. 2024: +6.8% YoY | First $250B+ holiday season
Online vs. In-Store Holiday Shopping Statistics
E-commerce accounted for 18.3% of total US retail sales during Q4 2025 on an unadjusted basis, up from 16.1% the prior year, a sign that the channel shift to digital continues even after the pandemic-era acceleration.
Online vs. In-Store Statistics
- Q4 2025 e-commerce totaled $316.1 billion (seasonally adjusted), up 5.3% from Q4 2024. US Census Bureau quarterly retail report, released March 2026.
- E-commerce accounted for 16.4% of total US retail sales across all of 2025, up from 16.1% in 2024, reflecting steady but no longer explosive channel shift.
- On an unadjusted Q4 basis, e-commerce represented 18.3% of total retail sales, the highest Q4 share ever recorded.
- Total US e-commerce for the full year 2025 reached $1,233.7 billion, up 5.4% from 2024.
- Buy online, pick up in store (BOPIS) was used for 1 in 5 holiday orders overall, peaking at 1 in 3 orders during the final five days before Christmas as shipping deadlines passed.
- Department store retail sales in December 2024 totaled $13.9 billion, illustrating that brick-and-mortar remains a meaningful piece of the holiday picture despite e-commerce growth.
The US Census Bureau data is the most authoritative government measurement of e-commerce share. For a broader view of US online shopping statistics, our research team has compiled trends across the full year. And it tells a nuanced story. The Q4 unadjusted share of 18.3% runs higher than the full-year 16.4% because the holiday period is more digital than the rest of the year. Even people who like browsing in person tend to close the purchase online when selection, price, and delivery speed matter most.
BOPIS keeps growing as a hybrid behavior. It’s not purely online or purely in-store. It’s both. From what we’ve tracked across the stores we monitor, BOPIS activity spikes sharply in the last week before Christmas every year. Shoppers want certainty over delivery risk. The 1-in-3 rate in the final five days confirms that on a large scale.
💡
Tip: BOPIS orders can often be combined with in-store coupons or loyalty rewards that don’t apply to shipped orders. Check your retailer’s coupon policy before choosing delivery vs. pickup.
Mobile Holiday Shopping Statistics
For the first time ever, mobile devices accounted for more than half of all online holiday transactions in 2025, with smartphones responsible for 56.4% of online purchases between November 1 and December 31.
Mobile Shopping Statistics
- Smartphones drove 56.4% of all online holiday transactions in 2025, the first year mobile exceeded 50% and a definitive crossing of the mobile-majority threshold.
- Buy now, pay later (BNPL) purchases showed even stronger mobile skew: 82.2% of all BNPL transactions during the 2025 holiday season were completed on smartphones.
- Mobile’s holiday share has grown steadily from an estimated 41% in 2022 to 47% in 2023, 51% in 2024, and 56.4% in 2025, a consistent 5-6 percentage point annual gain.
- The mobile shift affects coupon use directly: more than half of all holiday discount codes were now entered or auto-applied on a phone rather than a desktop.
The 2025 crossing of the 50% mobile threshold isn’t just a data point. It’s a real shift in how people buy. Most online gifts now get purchased on a phone. Desktop didn’t go away. It just got left behind.
For budget-conscious shoppers, this creates both an opportunity and a risk. Mobile checkout is faster, which is great for grabbing a deal before it sells out. But speed also means less time to find and apply a coupon code. Tracking deals across hundreds of stores, a pattern we see every year is that mobile coupon rates are lower than desktop during the holidays. Not because people don’t want to save. Because they don’t think to look for a code when checkout is just two taps away.
Black Friday and Cyber Monday Statistics
Cyber Monday 2025 generated $13.25 billion in online spend, making it the single largest US online shopping day of the year. Black Friday wasn’t far behind at $10.8 billion, and the full Cyber Week delivered $41.2 billion.
Black Friday and Cyber Monday Statistics
- Cyber Monday 2025 generated $13.25 billion in online spend, up 7.1% year-over-year, cementing its position as the largest single online shopping day in US history to that point.
- Black Friday 2025 drove $10.8 billion in online spend, up 9.1% year-over-year, growing faster on a percentage basis than Cyber Monday.
- Thanksgiving Day 2025 brought in $6.4 billion in online spend, up 5.3% year-over-year, as more shoppers skipped the in-store doorbusters in favor of browsing from the couch.
- Cyber Week 2025 (Thanksgiving through Cyber Monday) totaled $41.2 billion in online spend, up 7.7% year-over-year.
- Across the full 2025 holiday season, 25 individual days exceeded $4 billion in single-day online spending, compared to fewer than 10 such days in 2022.
- The National Retail Federation reported 202.9 million shoppers participated across the Thanksgiving weekend (Thursday through Monday) in 2025, spanning both online and in-store activity.
Cyber Week 2025: Online Spend by Day
Source: Adobe Analytics, 2025 holiday season final data
Cyber Monday$13.25B
Black Friday$10.8B
Thanksgiving Day$6.4B
Cyber Week total: $41.2B | Up 7.7% from 2024
Black Friday’s 9.1% growth rate beat Cyber Monday’s 7.1% for the first time in a few years. It goes against the idea that Black Friday is a dying in-store relic. Online Black Friday is growing fast. In-store Black Friday is also still big, just harder to pull out cleanly from the weekend data.
Here’s something pure-statistics roundups don’t address: not all Black Friday and Cyber Monday deals are equal. Retailers often inflate “original” prices before the event, making a 40% label accurate on paper but off in practice. From processing millions of coupon codes, we’ve seen that the sharpest savings during Cyber Week come from stacking a working code on top of the sale price at apparel and electronics stores. The advertised discount gets you to the start line. Not the finish.
Holiday Spending per Person: Planned vs. Actual
Pre-season surveys got it wrong. The post-holiday ICSC survey found the average person spent $1,081 on holiday goods and services. That’s well above most of the major pre-season estimates.
Per-Person Spending Statistics
- The post-holiday ICSC survey found 92% of US adults participated in holiday spending, with an average spend of $1,081 per person on holiday-related goods and services.
- The National Retail Federation’s pre-season survey projected average spending of $890 per person on gifts, decorations, and other holiday items for 2025.
- The Conference Board’s pre-season estimate was $990 average planned holiday spend, down 6.9% from $1,063 in 2024, reflecting consumer caution heading into the season.
- Deloitte’s 40th annual holiday survey found the average shopper expected to spend $1,595, down 10% from the prior year, with 77% expecting higher prices and 57% anticipating a weaker economy.
- KPMG’s consumer pulse survey found consumers expected to spend 4.6% more on average, putting their estimate at $847; 57% planned to self-gift with an average self-gift budget of $153, up 20% year-over-year.
- The “say-do gap” in holiday spending: consumers almost always plan to spend less than they actually do, especially when money feels tight.
The gap between the lowest pre-season estimate ($847 from KPMG) and the actual result ($1,081 from ICSC) is $234 per person. Multiply that by 246 million adults. You get roughly $57 billion in “unplanned” spending. That’s not a rounding error.
Why does this happen? Some of it is a survey design issue. Surveys ask about gifts; actual spending includes food, travel, decorations, and parties. Some of it is impulse. And some of it is what Deloitte’s research would call a mismatch between stated intentions and behavior under promotional pressure.
The self-gifting angle is interesting. KPMG found that 57% of consumers planned to shop for themselves during the holiday season. Average self-gift spend: $153, up 20% from the prior year. The lines between “buying gifts” and “grabbing something for yourself while the deals are live” are blurring. So when people underestimate their holiday spend, part of that gap is the headphones or jacket they grabbed on Black Friday.
Holiday Shopping by Generation
Gen Z was the generation with the biggest gap between plans and reality in 2025, spending nearly 21% more than the prior year despite pre-season surveys showing they planned to cut back more than any other age group.
Generational Spending Statistics
- Gen Z shoppers spent nearly 21% more in the 2025 holiday season compared to 2024, despite pre-season surveys indicating they planned to reduce spending. The largest say-do gap of any generation.
- High-income households’ share of total holiday spending jumped from 31.7% in 2024 to 38.5% in 2025, with upper-income consumers driving the lion’s share of overall spending growth.
- Overall consumer spending growth of 6.4% year-over-year was driven primarily by upper-income segments; middle- and lower-income consumers reduced purchase quantities and traded down on quality.
- 77% of holiday shoppers expected higher prices heading into the 2025 season; 57% anticipated a weaker economy, yet most still spent at or above prior-year levels.
- 35% of Americans self-identify as “vibe shoppers,” meaning impulse and emotion drive their holiday buying more than planned lists. SurveyMonkey’s 2025 holiday research identified this impulse-driven segment as one of the fastest-growing shopper types.
- 44% of holiday shoppers reported frustration with in-store overcrowding during the 2025 season, reinforcing the continued shift to online for those who have the option.
The income divergence story tells its own story. High-income households going from 31.7% to 38.5% of total holiday spend isn’t a small move. The trillion-dollar milestone was hit while many shoppers were cutting back. Budget buyers were in the market. They just needed deals and timing to stretch their dollars.
That matches what we see on our platform every November and December. Coupon redemptions spike relative to browsing more sharply during the holidays than any other time of year. Mostly among mid-range shoppers. They want to buy. They just need a reason, and a working 20%-off code is often that reason.
Gen Z’s 21% spending increase despite plans to cut back reflects two realities. First, this cohort is entering prime earning years and has more disposable income than surveys suggest. Second, the “vibe shopper” research from SurveyMonkey captures how this group actually buys. Plans and carts diverge. A lot.
Holiday Shopping Discount Statistics by Category
Electronics offered the steepest discounts of the entire 2025 holiday season, reaching 30.9% off listed price at peak, followed closely by toys at 29.6% off and apparel at 25.1% off.
Discount Statistics by Category
- Electronics discounts peaked at 30.9% off listed price during the 2025 holiday season, with the deepest discounts typically arriving on Cyber Monday rather than Black Friday.
- Toy discounts reached 29.6% off at peak, with Black Friday traditionally offering better toy prices than Cyber Monday as retailers compete for gift-givers buying early.
- Apparel discounts hit 25.1% off at peak, distributed more evenly across the full season rather than concentrated in a single event window.
- Television discounts reached 24.3% off at peak, with major TV deals concentrated in the Black Friday-to-Cyber Monday window rather than earlier or later.
- 13.7% of all 2024 hobby, toy, and game store sales occurred in December alone, confirming how seasonally concentrated toy purchasing is compared to most retail categories.
- Stacking a retailer’s holiday sale discount with a valid coupon code can push effective savings well beyond the advertised peak discount percentage in categories where combination offers are permitted.
The “when to buy which category” question is one most holiday statistics articles skip entirely. But the timing actually matters.
Electronics hit their deepest discounts on Cyber Monday, not Black Friday. Best Buy is typically the go-to destination for electronics deals during this window. Toy discounts peak on Black Friday and often don’t get better after that. Apparel discounts spread more evenly across the season, which means waiting for Cyber Monday on a sweater rarely gets you a better deal than buying it the week of Black Friday.
| Category | Peak Discount | Best Timing |
|---|---|---|
| Electronics | 30.9% off | Cyber Monday |
| Toys | 29.6% off | Black Friday |
| Apparel | 25.1% off | Even across season |
| Televisions | 24.3% off | Black Friday weekend |
What most guides miss is that advertised peak discounts are a ceiling, not a floor. The actual discount depends on the specific product, whether it’s already been marked down, and whether you’ve applied a coupon on top. Tracking deals across hundreds of stores, we consistently find the sharpest real savings in electronics come from layering a coupon on the Cyber Monday price. Not just trusting the advertised percentage.
Buy Now, Pay Later (BNPL) Holiday Statistics
BNPL reached $20 billion in total holiday spend during the 2025 season, up 9.8% year-over-year, making it one of the fastest-growing payment categories in the holiday shopping mix.
BNPL Holiday Statistics
- Buy now, pay later holiday spend reached $20 billion in the 2025 season (Nov 1-Dec 31), up 9.8% year-over-year. Adobe Analytics tracked this figure as part of its final 2025 season report.
- 82.2% of all BNPL holiday purchases in 2025 were completed on smartphones, making BNPL one of the most mobile-concentrated payment methods in retail.
- The National Retail Federation estimated 19.3% of online holiday sales would be returned in 2025, raising the question of how BNPL installment obligations get handled when the item comes back.
- BNPL adoption during the holiday season has grown from roughly $14B in 2022 to $20B in 2025, a 43% increase over three years as more retailers integrate BNPL options at checkout.
BNPL is useful as a cash flow tool for managing large holiday purchases across multiple paychecks. But it’s not a savings tool. The price you pay with BNPL is the same price you’d pay without it, assuming no interest. A coupon code reduces the total cost; BNPL only spreads it.
That distinction matters most during the holidays. Promotional pressure is highest. Purchase volumes are largest. Using BNPL on a full-price item when a 20%-off code was available means spreading out a cost you didn’t have to pay at full price. The two tools serve different goals. Use the coupon to cut the total. Use BNPL to manage the timing. Both, ideally.
AI and Holiday Shopping Statistics
AI-generated traffic to retail websites surged 693.4% during the 2025 holiday season compared to the same period in 2024, making it the fastest-growing traffic source for e-commerce by a wide margin.
AI Shopping Statistics
- AI-driven traffic to retail websites grew 693.4% year-over-year during the 2025 holiday season. Adobe Analytics measured this by tracking referral traffic from AI assistants and agents to retail sites.
- AI and agents drove 20% of all global retail sales (about $282 billion) during the 2025 holiday season. Salesforce compiled this figure across its merchant network.
- Retailers that deployed AI agents grew at a 59% higher rate than retailers without AI (6.2% vs. 3.9% YoY), based on Salesforce’s holiday merchant data.
- 33% of holiday shoppers in 2025 used ChatGPT to help them shop, up from just 3% in 2024, a 10x increase in one year in large language model adoption for gift research.
- 85% of Americans did not use AI tools for gift-giving or shopping during the 2025 holiday season, illustrating that consumer adoption is still far behind the infrastructure investment by retailers.
The AI numbers tell two stories that seem to contradict each other. On the retailer side, AI adoption is happening fast. Merchants using AI agents grew at nearly 60% higher rates. On the consumer side, most shoppers still found their gifts the old-fashioned way. A jump from 3% to 33% chatbot usage sounds huge, but it still means 2 in 3 holiday shoppers weren’t using AI at all.
So where does that leave the 33% who used ChatGPT? Mostly in the discovery phase. AI is good at generating gift ideas and narrowing down product categories. But it doesn’t check whether a coupon exists for the retailer you’re about to buy from. That last step, turning an AI recommendation into a purchase at the best price, still requires a human search or a purpose-built tool. AI can suggest a specific coffee maker. It won’t tell you there’s a 15%-off code expiring at midnight.
When Consumers Start Holiday Shopping
Early holiday shopping hit new heights in 2025, driven partly by tariff fears and partly by a multi-year trend of the season starting earlier. By September 2025, 69% of shoppers had already begun their holiday shopping, per a 1,027-person consumer survey by TSG/ETA.
Shopping Timing Statistics
- 69% of US holiday shoppers had already begun their shopping by September 2025. The TSG/ETA Consumer Holiday Spending Study surveyed 1,027 US shoppers and published results in November 2025.
- NRF historical data shows roughly 40% of consumers begin holiday shopping before Halloween. That share appears to have grown in 2025 as tariff anxiety pushed shoppers to start earlier.
- 57% of consumers anticipated higher prices due to tariffs in 2025, motivating earlier purchasing to lock in current prices before potential increases. KPMG’s consumer pulse survey captured this tariff-driven anxiety among shoppers heading into the season.
- The Conference Board found that average planned gift spend was down 3.9% heading into the season, suggesting consumers were managing anxiety about prices by planning tighter budgets rather than stopping purchases altogether.
- Despite early start intentions, the biggest discount windows (Black Friday, Cyber Monday) still arrive late in the season, creating a real trade-off between price certainty and potential savings timing.
The “start early to beat price increases” logic made sense in 2025. For items with real supply limits, buying in October probably did help some shoppers avoid stockouts. But for most product categories, the deeper discounts still came in November and December.
That’s the timing trade-off that rarely gets explained directly. Buy early: lower risk, higher price. Buy late: better discounts, higher stockout risk. Most guides say “start early” and stop there. The smarter read: for specific must-have gifts where stockout is a real concern, buy early. For most other categories, electronics and apparel especially, waiting for Cyber Week typically yields better prices.
Post-Holiday Returns Statistics
More than $181 billion worth of global holiday online purchases were returned after the 2025 season. That’s 14% of all purchases made between November 1 and December 31 and a 10% increase from the prior year.
Post-Holiday Returns Statistics
- More than $181 billion in global online purchases from the November 1-December 31 window were returned after the season, representing 14% of all purchases and a 10% year-over-year increase.
- The National Retail Federation estimated that 19.3% of online holiday sales would be returned in 2025, with total retail returns expected to cost retailers nearly $850 billion across the full year.
- Return rates are rising faster than purchase volumes, creating net margin pressure on retailers even in record-revenue seasons like 2025.
- Department store retail sales in December 2024 totaled $13.9 billion, a data point that contextualizes the scale of in-store holiday purchasing that also generates January return traffic.
- The rise in BNPL adoption intersects with returns risk: consumers who return items purchased via BNPL may still owe installments depending on the platform’s return processing timeline.
The $181 billion return figure is big, but it follows a logical pattern. Record purchase volumes driven partly by over-buying equal a record return wave in January. More buying plus more “I’m not sure about this” buying leads to that result.
For shoppers, there’s a practical takeaway: return policy matters as much as price. A $50 item with free returns is less risky than a $45 version with a $6.99 return shipping fee. The total-cost calculation now includes what it costs to send something back.
Understanding return policies before you click “buy” is part of smart holiday shopping. Most major US retailers post their return windows clearly. Some compress them during the holidays. Worth checking before the season, not after you’ve opened the box.
Small Business Holiday Shopping Statistics
8 in 10 small businesses say the holiday season is critical for their overall annual profit. The US Small Business Administration’s Small Business Index documented that a majority of small businesses rely on holiday shopping for at least one quarter of their yearly revenue.
Small Business Statistics
- 8 in 10 small businesses describe the holiday season as important or critical to their annual profitability. The US Small Business Administration’s Small Business Index tracks this metric as part of its annual small business health survey.
- A majority of small businesses rely on November-December holiday shopping for at least one quarter of their total annual revenue, making it the single most important two-month window of their fiscal year.
- Intuit QuickBooks’ 2025 holiday survey found consumers planned to spend $263 billion total that holiday season, with $109 billion directed specifically toward small businesses.
- American Express Small Business Saturday 2024 generated an estimated $22.7 billion in consumer spending, per the annual AmEx shopper spending survey.
- Small Business Saturday is the day after Black Friday. It’s grown into its own shopping event, with small retailers running promotions distinct from the big-box Black Friday deals.
The $109 billion flowing to small businesses during the holiday season is a number that gets lost inside the trillion-dollar headline. But for the small retailer or Etsy shop trying to hit their annual revenue target, the difference between a good November-December and a poor one can determine whether the business survives the following year.
From what we’ve tracked across coupon usage patterns, small businesses tend to have simpler coupon setups than big retailers. Fewer BOPIS conditions. Fewer fine-print exclusion lists. Often more flexibility on returns. For shoppers who want savings without the complexity, small retailers during the holidays can be the easier path, especially for home goods, specialty food, and handmade gifts. Browse Etsy coupons for handmade gift savings during the season.
Seasonal Employment Statistics
The US retail sector typically adds between 500,000 and 800,000 seasonal jobs during the October-December holiday period, a range that reflects how retailer confidence in consumer demand shapes their hiring decisions.
Seasonal Employment Statistics
- The US retail sector typically adds between 500,000 and 800,000 seasonal jobs during the October-December holiday period each year, based on Bureau of Labor Statistics seasonal adjustment data for retail trade employment.
- The US imported $3.97 billion worth of Christmas decorations from China in 2024, with China accounting for 86.8% of all US Christmas decoration imports by value.
- Seasonal retail hiring functions as a leading indicator of retailer confidence: years where hiring runs below the historical average typically correlate with retailer caution about consumer demand or labor cost pressure.
- Beyond retail, the holiday season drives seasonal hiring across warehousing, logistics, delivery services, and customer service, with e-commerce growth expanding seasonal hiring beyond traditional brick-and-mortar roles.
The Christmas decoration import figure is striking: $3.97 billion from China, which is 86.8% of everything the US imports in that category. Tariff discussions in 2025 had real stakes for decoration prices. Nearly all of them come from one country. Shoppers who bought decorations in August or September sidestepped whatever price increases hit later.
Holiday Shopping Methodology
This article compiles holiday shopping statistics from primary government sources, major industry research firms, and academic institutions. Data is cited inline throughout the article, with every source linked to the original report or release where a specific URL was available.
A note on data currency: government agencies typically publish survey results 12-18 months after the year closes. The Census Bureau’s e-commerce data in this article covers Q4 2025 and was released March 10, 2026. BLS retail employment data reflects late 2025 figures. Where stats refer to 2024 or earlier, they are the most recent public release at the time of writing.
Key sources used in this article and their “holiday season” definitions:
- Adobe Analytics uses November 1-December 31 for holiday season tracking
- National Retail Federation (NRF) uses Thanksgiving through Christmas, though the NRF Thanksgiving weekend shopper count covers Thursday-Monday
- Salesforce uses November 1-January 31 for holiday/returns data, which explains higher return volume figures
- US Census Bureau provides quarterly e-commerce data on a seasonally adjusted and unadjusted basis
Most 2025 holiday data was published January-March 2026. Pre-season forecasts and post-season actuals are clearly labeled throughout. Where surveys report the same metric differently (like per-person spend), the explanation is in how each survey was designed.
The Bottom Line
The 2025 US holiday season set records on nearly every measure: first trillion-dollar season, first mobile-majority year online, and the biggest AI traffic surge ever. For shoppers, the most useful data is the discount calendar. Electronics peak on Cyber Monday at 30.9% off. Toys peak on Black Friday at 29.6% off. Apparel spreads more evenly across the season. The strategy that beats both early shopping and impulse buying: time your purchase to the category’s peak discount window, then layer a working coupon code on top of the sale price to push savings beyond what the advertised number shows.
Frequently Asked Questions
How much does the average person spend on holiday gifts?
The average American spent $1,081 on holiday goods and services in 2025. That comes from the post-holiday ICSC survey, conducted after the season closed. Pre-season estimates ran lower: NRF projected $890, Conference Board estimated $990, KPMG put it at $847. The gap between planned and actual spending shows up every year. It likely reflects impulse purchases, self-gifting, and spending on food, travel, and parties that survey respondents don’t count upfront.
What percentage of annual retail sales occur during the holiday season?
Q4 always makes up a much higher share of annual retail than any other quarter. In Q4 2025, e-commerce totaled $316.1 billion (seasonally adjusted). On an unadjusted basis, e-commerce was 18.3% of Q4 retail, compared to 16.4% for the full year. For toys and games, December alone is 13.7% of annual sales. That’s how seasonal the category is.
How much holiday shopping is done online versus in-store?
E-commerce was 18.3% of total US Q4 retail on an unadjusted basis, per the Census Bureau. Adobe Analytics tracked $257.8 billion in online holiday spend (November-December). Salesforce tracked $294 billion in US online sales across a broader November-January window. In-store remains significant, especially for last-minute buys. And BOPIS bridges both channels at roughly 1 in 5 holiday orders.
What are the most popular gift categories each holiday season?
Electronics are always the top gift category. Adobe Analytics data shows electronics offered the deepest discounts in 2025 at 30.9% off peak. Toys are heavily holiday-concentrated: 13.7% of annual toy store sales happen in December alone. Apparel is the third major category at 25.1% off peak. Food, beauty, and home goods all grew 6-8% year-over-year in the most recent holiday season as well.
How many people shop on Black Friday and Cyber Monday?
The National Retail Federation reported 202.9 million shoppers across the full Thanksgiving weekend in 2025. That covers both online and in-store. Adobe tracked $10.8 billion in Black Friday online spend and $13.25 billion on Cyber Monday. Both were all-time records. Note: those figures are online only and don’t include in-store volume.
What are the biggest holiday shopping days of the year?
Cyber Monday 2025 was the largest single online shopping day in US history at $13.25 billion, followed by Black Friday at $10.8 billion and Thanksgiving Day at $6.4 billion. Across the full 2025 season, 25 individual days exceeded $4 billion in single-day online spend, compared to fewer than 10 such days in 2022. The full Cyber Week (Thanksgiving through Cyber Monday) generated $41.2 billion in online spend.
How does inflation and tariff anxiety affect holiday spending?
Despite 77% of shoppers expecting higher prices and 57% expecting a weaker economy, total spending still grew 6.4% year-over-year. But the anxiety showed up in behavior. Consumers started shopping earlier, traded down on quality, and bought less. Mostly in middle- and lower-income households. High-income households actually increased their share of holiday spending from 31.7% to 38.5%, which is where most of the growth came from.
How many seasonal jobs are created for the holiday rush?
The US retail sector typically adds 500,000 to 800,000 seasonal jobs each October-December. That figure comes from BLS retail employment data. And the impact goes well beyond retail floors. Warehousing, logistics, delivery, and customer service all see major seasonal hiring too, driven largely by e-commerce volume growth.
Data compiled by the DontPayFull Research Team based on publicly available data from government agencies, academic institutions, and industry research firms.
Sources
- Adobe Analytics, 2025 Holiday Shopping Season Final Data: Comprehensive report covering online spend, mobile share, BNPL, AI traffic, and category discount depths. Published January 2026.
- Adobe Analytics, US Holiday Shopping Season Forecast: Pre-season forecast for 2025 holiday online spend. Published October 2025.
- National Retail Federation, Winter Holiday Data and Trends: NRF annual holiday tracking data including Thanksgiving weekend shopper count and per-person spend projections.
- Salesforce, 2025 Holiday Shopping Data: Global and US online sales, BOPIS data, AI agent impact, and returns statistics. Published January 2026.
- PwC, Holiday 2025 Spending Analysis: Post-holiday consumer spending growth, income divergence, and Gen Z behavior data. Published January 2026.
- US Census Bureau, Quarterly Retail E-Commerce Sales: Official government e-commerce tracking, Q4 2025 data released March 10, 2026.
- US Census Bureau, 2025 Winter Holiday Season Facts: December 2024 retail sales by category, import data for Christmas decorations.
- ICSC / Business Wire, 2025 Post-Holiday Consumer Survey: Post-season actual spending survey of 246 million US adult participants. Published January 2026.
- Deloitte, 40th Annual Holiday Retail Sales Consumer Survey: Pre-season consumer sentiment, price expectations, and planned spending. Published October 2025.
- KPMG, Consumer Pulse Survey Holiday 2025: Consumer spending expectations, self-gifting trends, and tariff impact data. Published October 2025.
- The Conference Board, Holiday Spending 2025: Consumer confidence and planned holiday spending. Published November 2025.
- Tinuiti, Holiday Shopping Statistics: Consumer purchase driver survey (price, free shipping, discounts) and AI/ChatGPT adoption data.
- SurveyMonkey, Holiday Shopping Trends and Insights 2025: Consumer behavior survey including “vibe shopper” data, AI adoption, and in-store frustration findings.
- Intuit QuickBooks, Holiday Shopping Survey: Consumer planned spending allocation, including $109 billion directed to small businesses.
- TSG/ETA, Consumer Holiday Spending Study 2025: 1,027-person US shopper survey, September 2025 shopping start timing. Published November 2025.
- US Small Business Administration, Observances: Season of Small Business: SBA Small Business Index holiday season importance data.
Do You Have Any Suggestions?
We're always looking for ways to enrich our content on DontPayFull.com. If you have a valuable resource or other suggestion that could enhance our existing content, we would love to hear from you.
Was this content helpful to you?
Related Articles